


Looker Studio でAPI のデータと連携した可視化を作成する方法

Looker Studio(旧Google データポータル)を使えば、リッチな可視化を追加したダッシュボードやレポートを簡単に作成できます。CData Connect AI と組み合わせることで、API のデータに簡単に接続してLooker Studio からデータを連携利用できます。この記事では、Looker Studio からCData Connect AI を通してAPI に連携し、API のデータを使用した可視化を作成する方法を説明します。
CData Connect AI offers a seamless cloud-to-cloud interface tailored for your API, making it straightforward to construct reports directly from liveAPI のデータwithin Looker Studio without the need for data replication. As you create visualizations, Looker Studio generates queries to retrieve data. With its inherent optimized data processing capabilities, CData Connect AI efficiently channels all supported query operations, including filters, JOINs, and more, directly to your API. This leverages server-side processing to swiftly provide the requested API のデータ.
Connect AI からAPI への接続
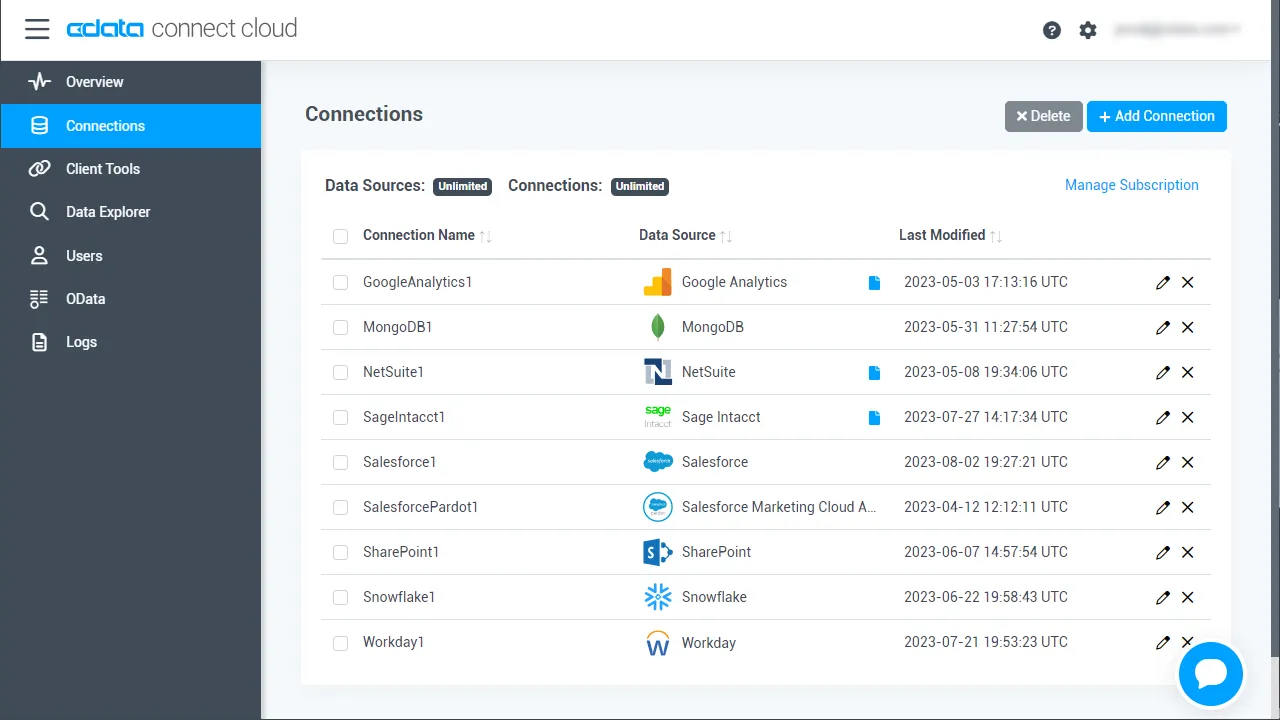
CData Connect AI では、直感的なクリック操作ベースのインターフェースを使ってデータソースに接続できます。
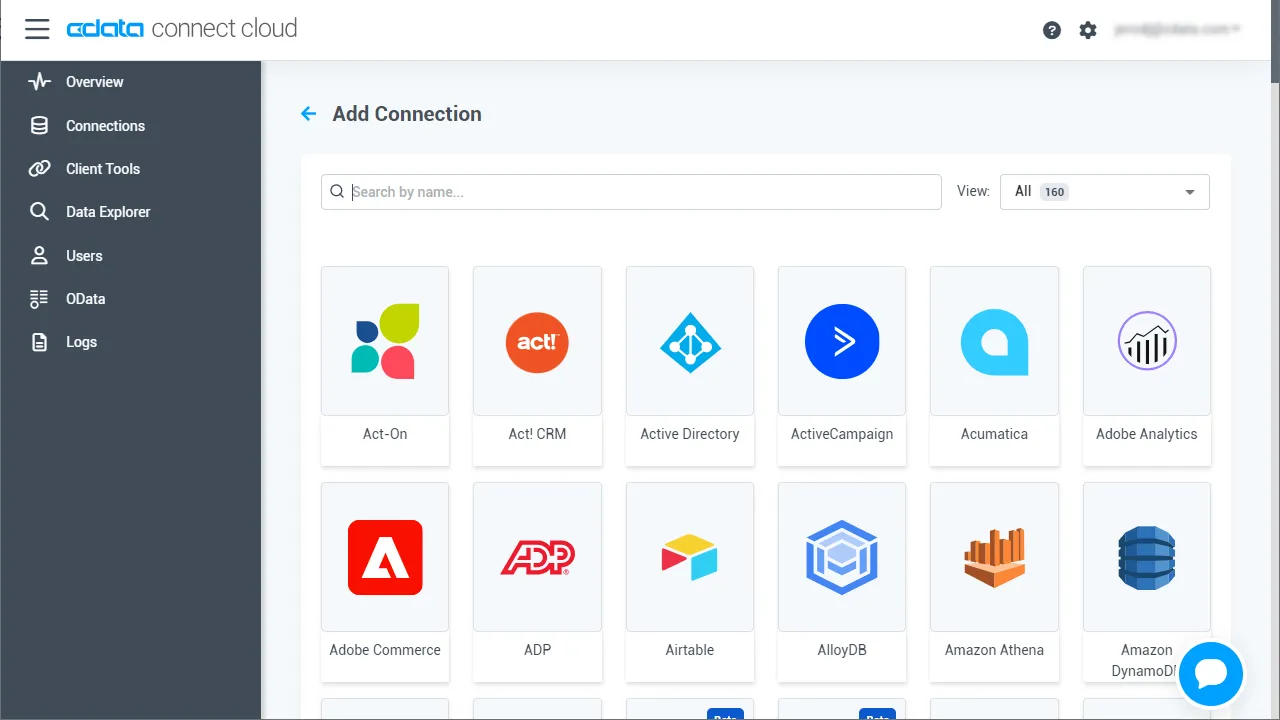
- Connect AI にログインし、 Add Connection をクリックします。
- 「Add Connection」パネルから「API」を選択します。
-
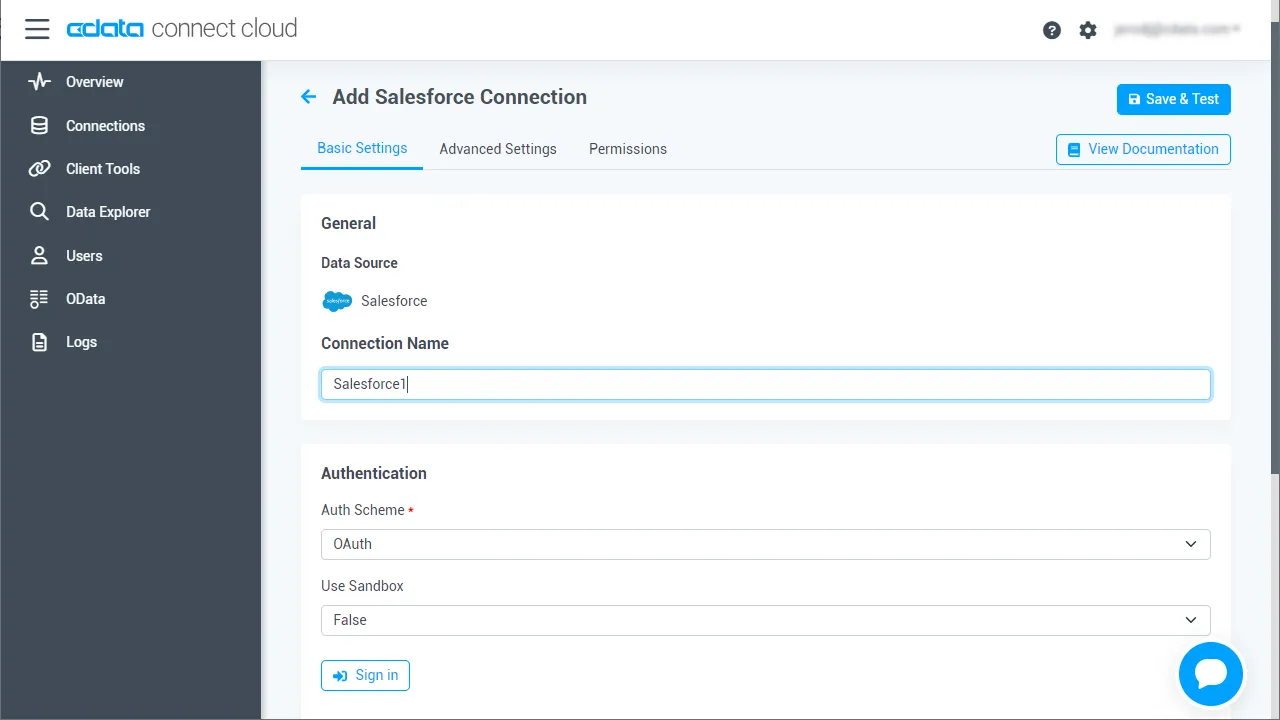
必要な認証プロパティを入力し、API に接続します。
To connect to your API, configure the following properties on the Global Settings page:
- In Authentication, select the Type and fill in the required properties
- In Headers, add the required HTTP headers for your API
- In Pagination, select the Type and fill in the required properties
After the configuring the global settings, navigate to the Tables to add tables. For each table you wish to add:
- Click "+ Add"
- Set the Name for the table
- Set Request URL to the API endpoint you wish to work with
")
- (Optional) In Parameters, add the required URL Parameters for your API endpoint
- (Optional) In Headers, add the required HTTP headers for the API endpoint
- In Table Data click " Configure"
- Review the response from the API and click "Next"
")
- Select which element to use as the Repeated Elements and which elements to use as Columns and click "Next"
")
- Preview the tabular model of the API response and click "Confirm"
")
- Create & Tast をクリックします。
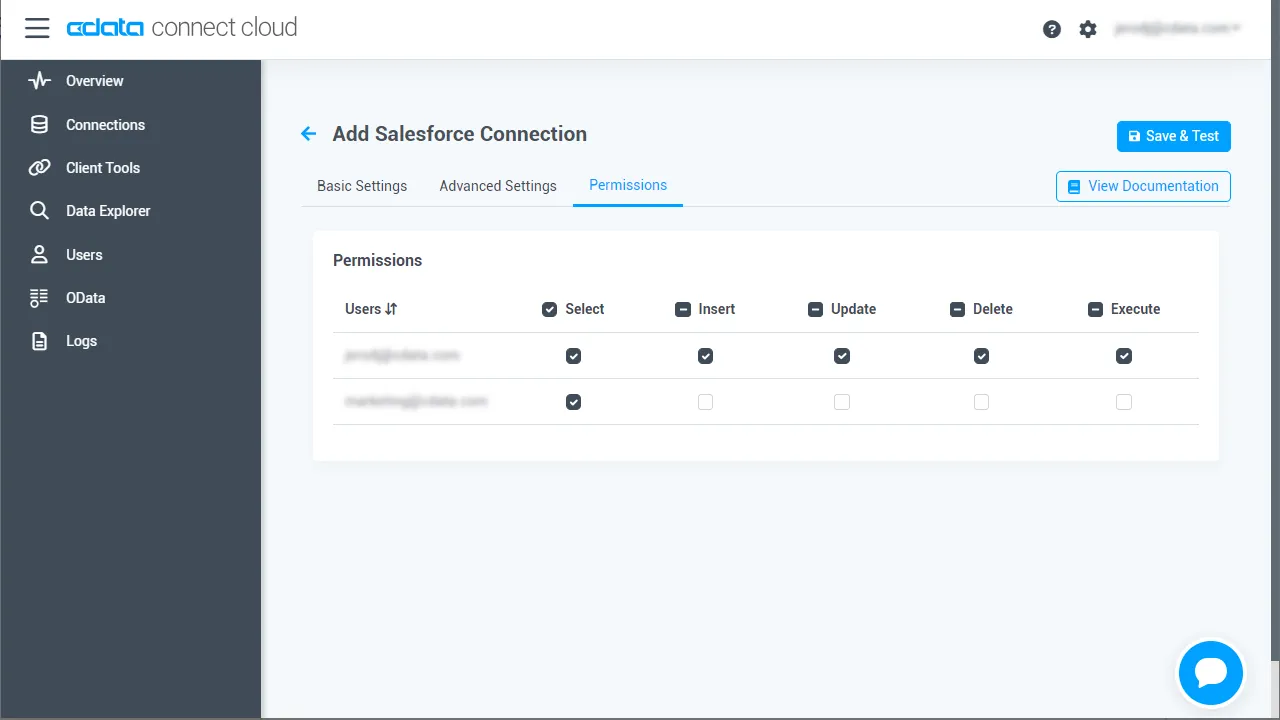
- 「Add API Connection」ページの「Permissions」タブに移動し、ユーザーベースのアクセス許可を更新します。
コネクションの設定が完了したら、Looker Studio からAPI のデータへの接続準備ができました。
API のリアルタイムデータにLooker Studio からアクセス
それでは、Looker Studio からCData Connect AI に接続して新しいAPI のデータソースを作成し、データを使った可視化を作成していきましょう。
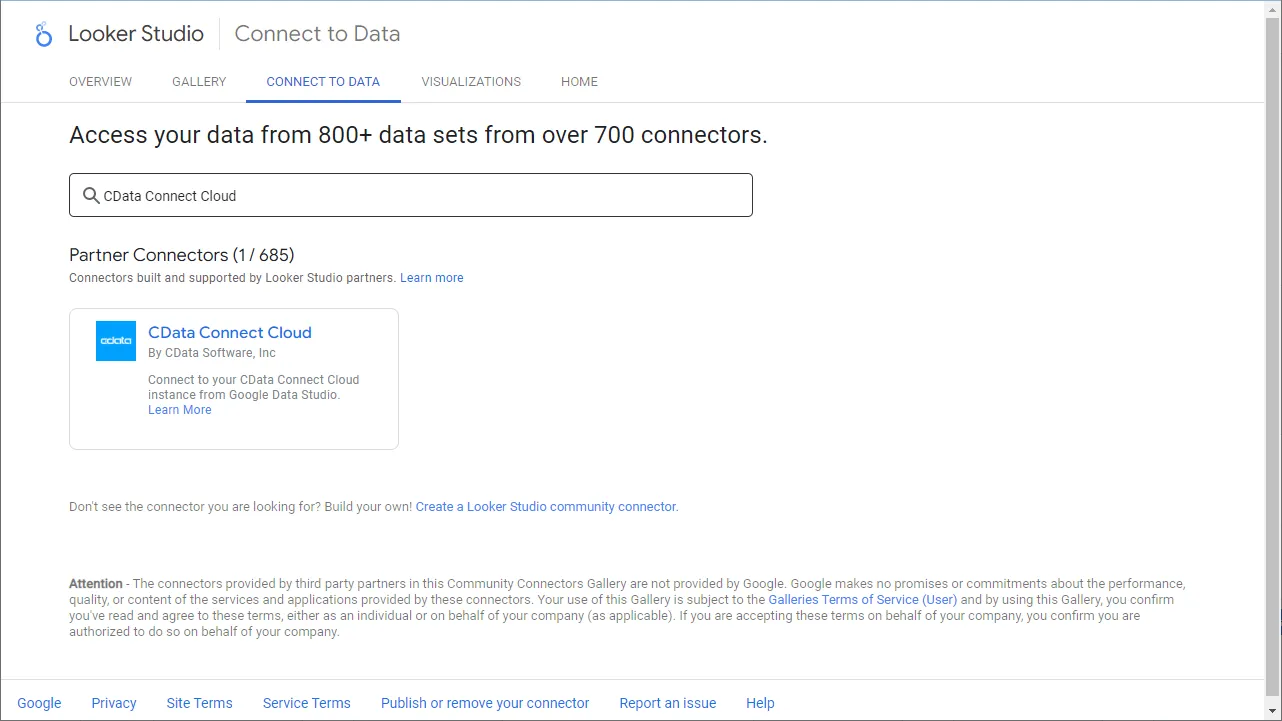
- Looker Studio にログインして、「作成」ボタンから新しいデータソースを作成し、CData Connect AI Connector を選択します。
- 「Authorize」をクリックしてGoogle アカウントへのアクセスを許可します。
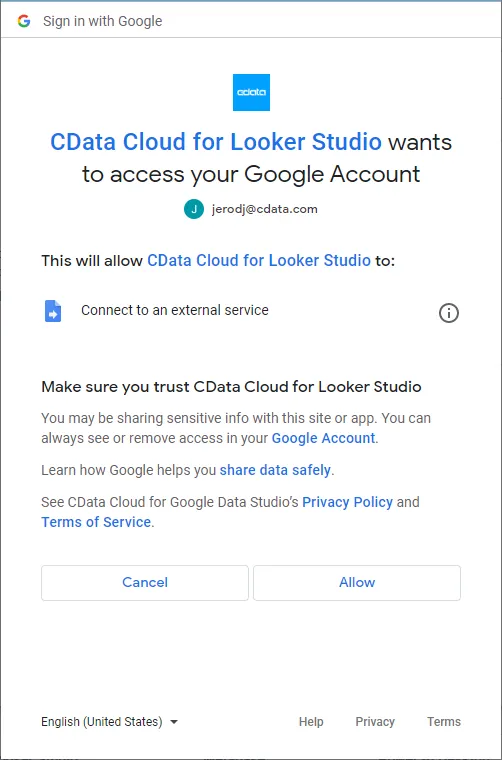
- 「Authorize」をクリックしてご利用のCData Connect AI インスタンスを認証します。
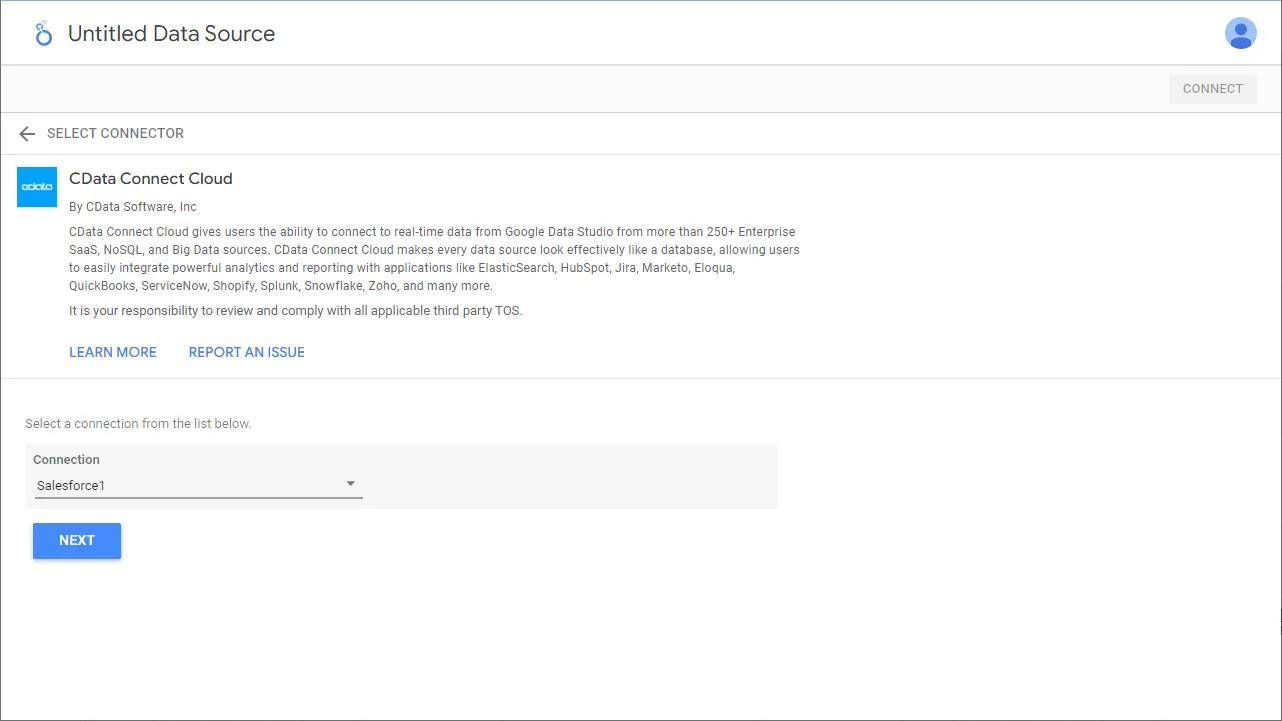
- Looker Studio のCData Connect AI Connector でコネクション(例:API1)を選択し、「Next」をクリックします。
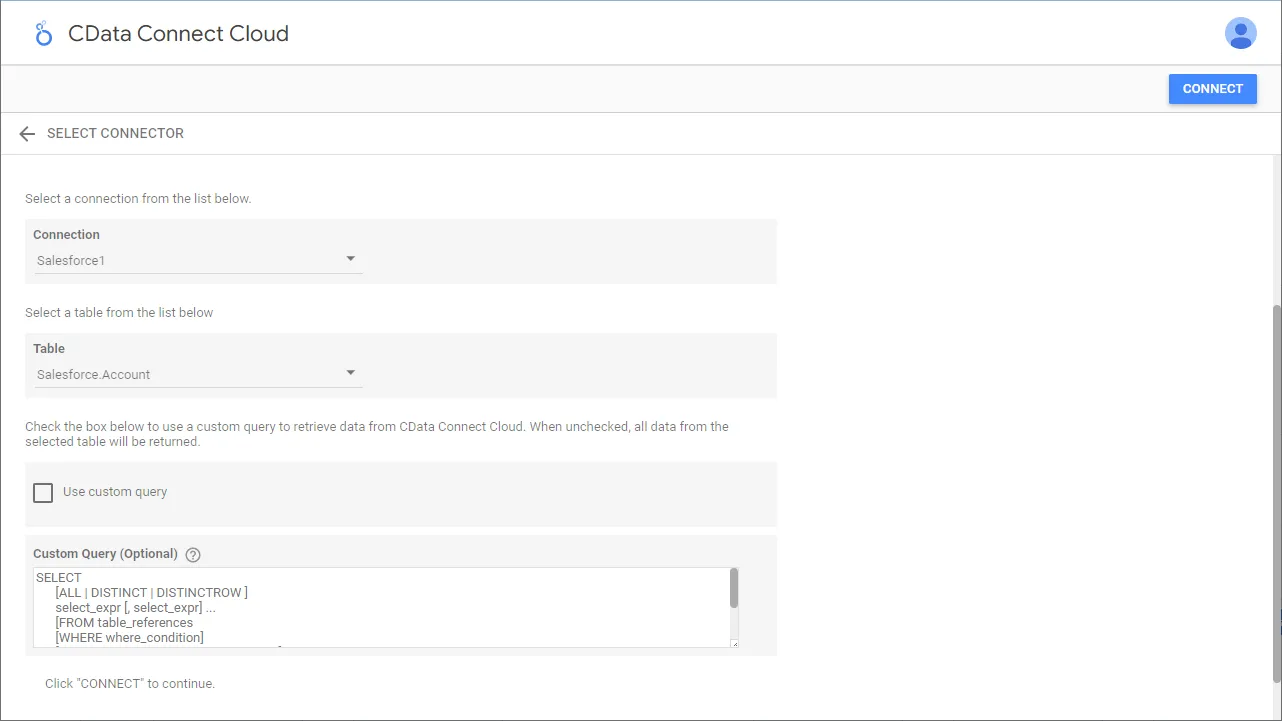
- テーブル(例:posts)を選択するかCustom Query を使用して、「CONNECT」をクリックして次に進みます。
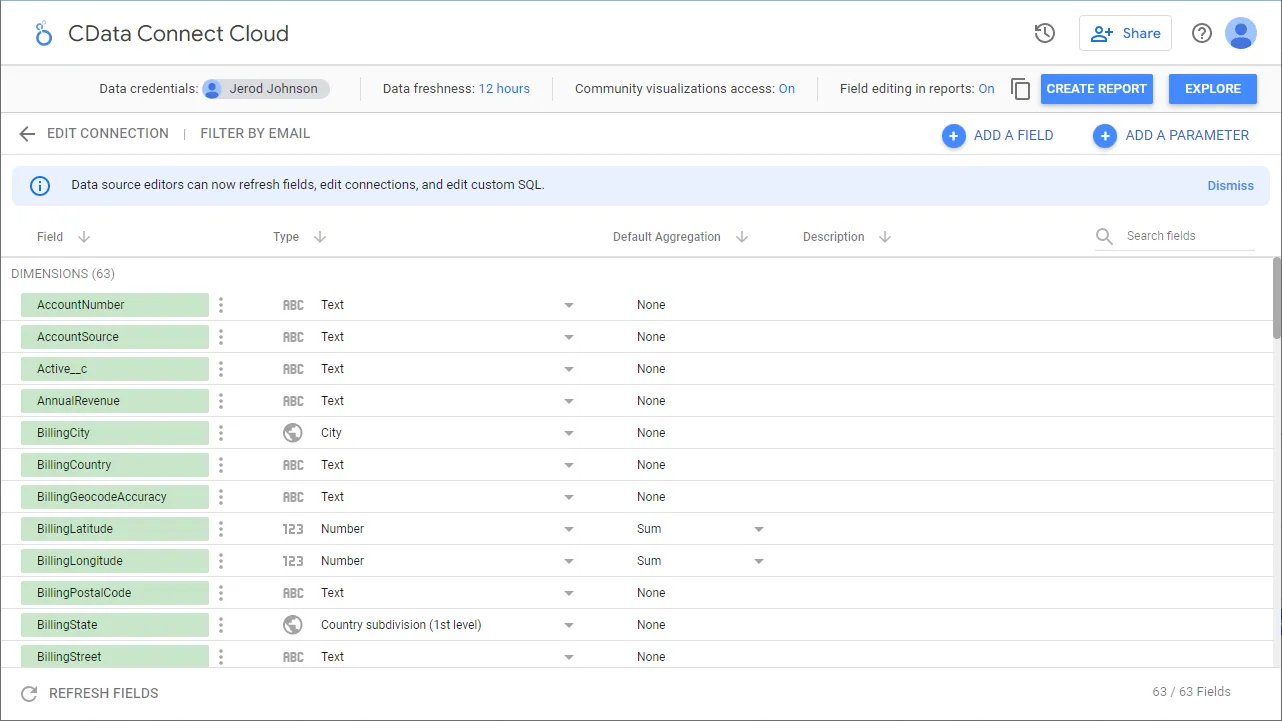
- 必要な場合にはカラムを変更して、「レポートを作成」をクリックしてデータソースをレポートに追加します。
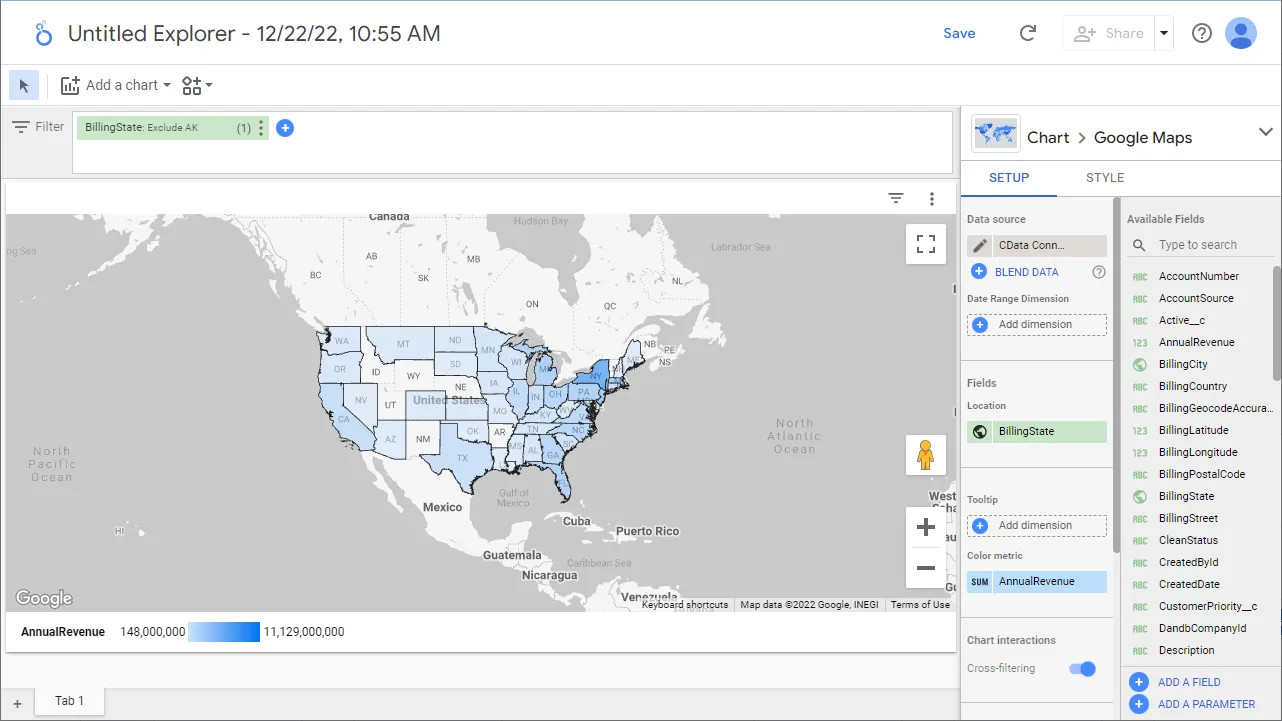
- 可視化のスタイルを選択してレポートに追加します。
- ディメンションと指標を選択して可視化を作成します。これで、API のデータの可視化が作成できました。
クラウドアプリケーションからAPI のデータへのリアルタイム連携
これで、可視化の作成は完了です。あとは、API から自在にデータを取得して、ダッシュボード構築やレポーティングに活用できます。
クラウドアプリケーションから150を超えるSaaS、ビッグデータ、NoSQL データソースへのリアルタイムデータ連携の実現には、CData Connect AI の14日間無償トライアルをぜひお試しください。