


CData API Server を介してPower BI でリアルタイムAPI のデータの可視化を作成

Power BI を使えば、データを美しいビジュアルに可視化したり、重要な情報を整理してダッシュボード化できます。CData API Server と組み合わせることで、可視化やダッシュボードなどのためにAPI のデータを使用できます。この記事では、CData API Server を使用してAPI の仮想データベースを作成し、API のデータを使ったレポートをPower BI で作成する方法を説明します。
API Server の設定
以下のリンクからAPI Server の無償トライアルをスタートしたら、セキュアなAPI OData サービスを作成していきましょう。
API への接続
Power BI からAPI のデータを操作するには、まずyour API への接続を作成・設定します。
- API Server にログインして、「Connections」をクリックします。

- 「接続を追加」をクリックして、データソースがAPI Server に事前にインストールされている場合は、一覧から「API」を選択します。
- 事前にインストールされていない場合は、「インストール済み」のチェックマークを外します。その後、一覧から「API」を検索して「コネクタをインストール」をクリックしてください。

- インストールできたら、接続設定を行っていきましょう!

-
To connect to your API, configure the following properties on the Global Settings page:
- In Authentication, select the Type and fill in the required properties
- In Headers, add the required HTTP headers for your API
- In Pagination, select the Type and fill in the required properties
After the configuring the global settings, navigate to the Tables to add tables. For each table you wish to add:
- Click "+ Add"
- Set the Name for the table
- Set Request URL to the API endpoint you wish to work with
")
- (Optional) In Parameters, add the required URL Parameters for your API endpoint
- (Optional) In Headers, add the required HTTP headers for the API endpoint
- In Table Data click " Configure"
- Review the response from the API and click "Next"
")
- Select which element to use as the Repeated Elements and which elements to use as Columns and click "Next"
")
- Preview the tabular model of the API response and click "Confirm"
")
- 接続情報の入力が完了したら、「保存およびテスト」をクリックします。
To connect to your API, configure the following properties on the Global Settings page:
- In Authentication, select the Type and fill in the required properties
- In Headers, add the required HTTP headers for your API
- In Pagination, select the Type and fill in the required properties
After the configuring the global settings, navigate to the Tables to add tables. For each table you wish to add:
- Click "+ Add"
- Set the Name for the table
- Set Request URL to the API endpoint you wish to work with
- (Optional) In Parameters, add the required URL Parameters for your API endpoint
- (Optional) In Headers, add the required HTTP headers for the API endpoint
- In Table Data click " Configure"
- Review the response from the API and click "Next"
- Select which element to use as the Repeated Elements and which elements to use as Columns and click "Next"
- Preview the tabular model of the API response and click "Confirm"
API Server のユーザー設定
次に、API Server 経由でAPI にアクセスするユーザーを作成します。「Users」ページでユーザーを追加・設定できます。やってみましょう。
- 「Users」ページで ユーザーを追加をクリックすると、「ユーザーを追加」ポップアップが開きます。
-
次に、「ロール」、「ユーザー名」、「権限」プロパティを設定し、「ユーザーを追加」をクリックします。

-
その後、ユーザーの認証トークンが生成されます。各ユーザーの認証トークンとその他の情報は「Users」ページで確認できます。

API 用のAPI エンドポイントの作成
ユーザーを作成したら、API のデータ用のAPI エンドポイントを作成していきます。
-
まず、「API」ページに移動し、
「 テーブルを追加」をクリックします。

-
アクセスしたい接続を選択し、次へをクリックします。

-
接続を選択した状態で、各テーブルを選択して確認をクリックすることでエンドポイントを作成します。

OData のエンドポイントを取得
以上でAPI への接続を設定してユーザーを作成し、API Server でAPI データのAPI を追加しました。これで、OData 形式のAPI データをREST API で利用できます。API Server の「API」ページから、API のエンドポイントを表示およびコピーできます。

Power BI からAPI のデータを取得
以下のステップを実行して、Power BI から作成したOData エンドポイントに接続します。
-
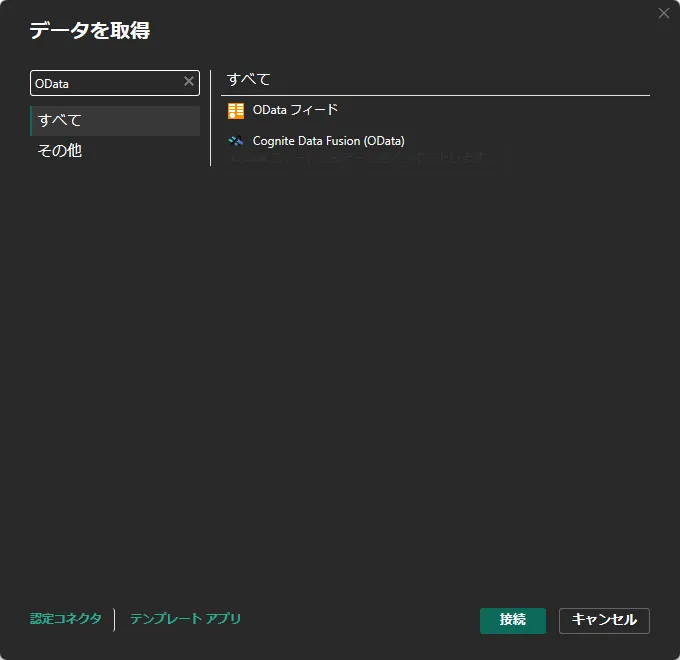
「Power BI Desktop」を開いて「データを取得」画面を表示します。検索ボックスに「odata」と入力すると「OData フィード」が表示されるので、これを選択して「接続」をクリックします。
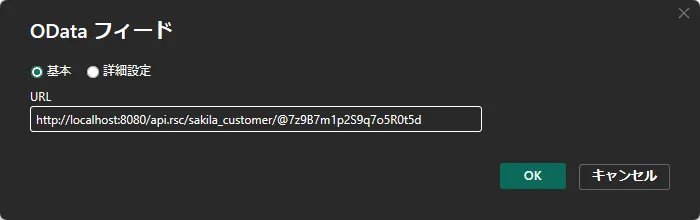
「OData フィード」の接続画面で、先ほど作成したテーブルのエンドポイントに認証トークンを付加したURLを指定します。以下の形式です。
https:///api.rsc//@/接続できるテーブルは、API Server のhttps://<ホスティング先>/api.rstで確認できます。
API のデータの可視化を作成
Power BI にデータを接続したら、「フィールド」ペインのフィールドをキャンバスにドラッグすることで、レポートビューにデータを可視化できます。図表の種類と、ビジュアライズするディメンションおよびメジャーを選択します。
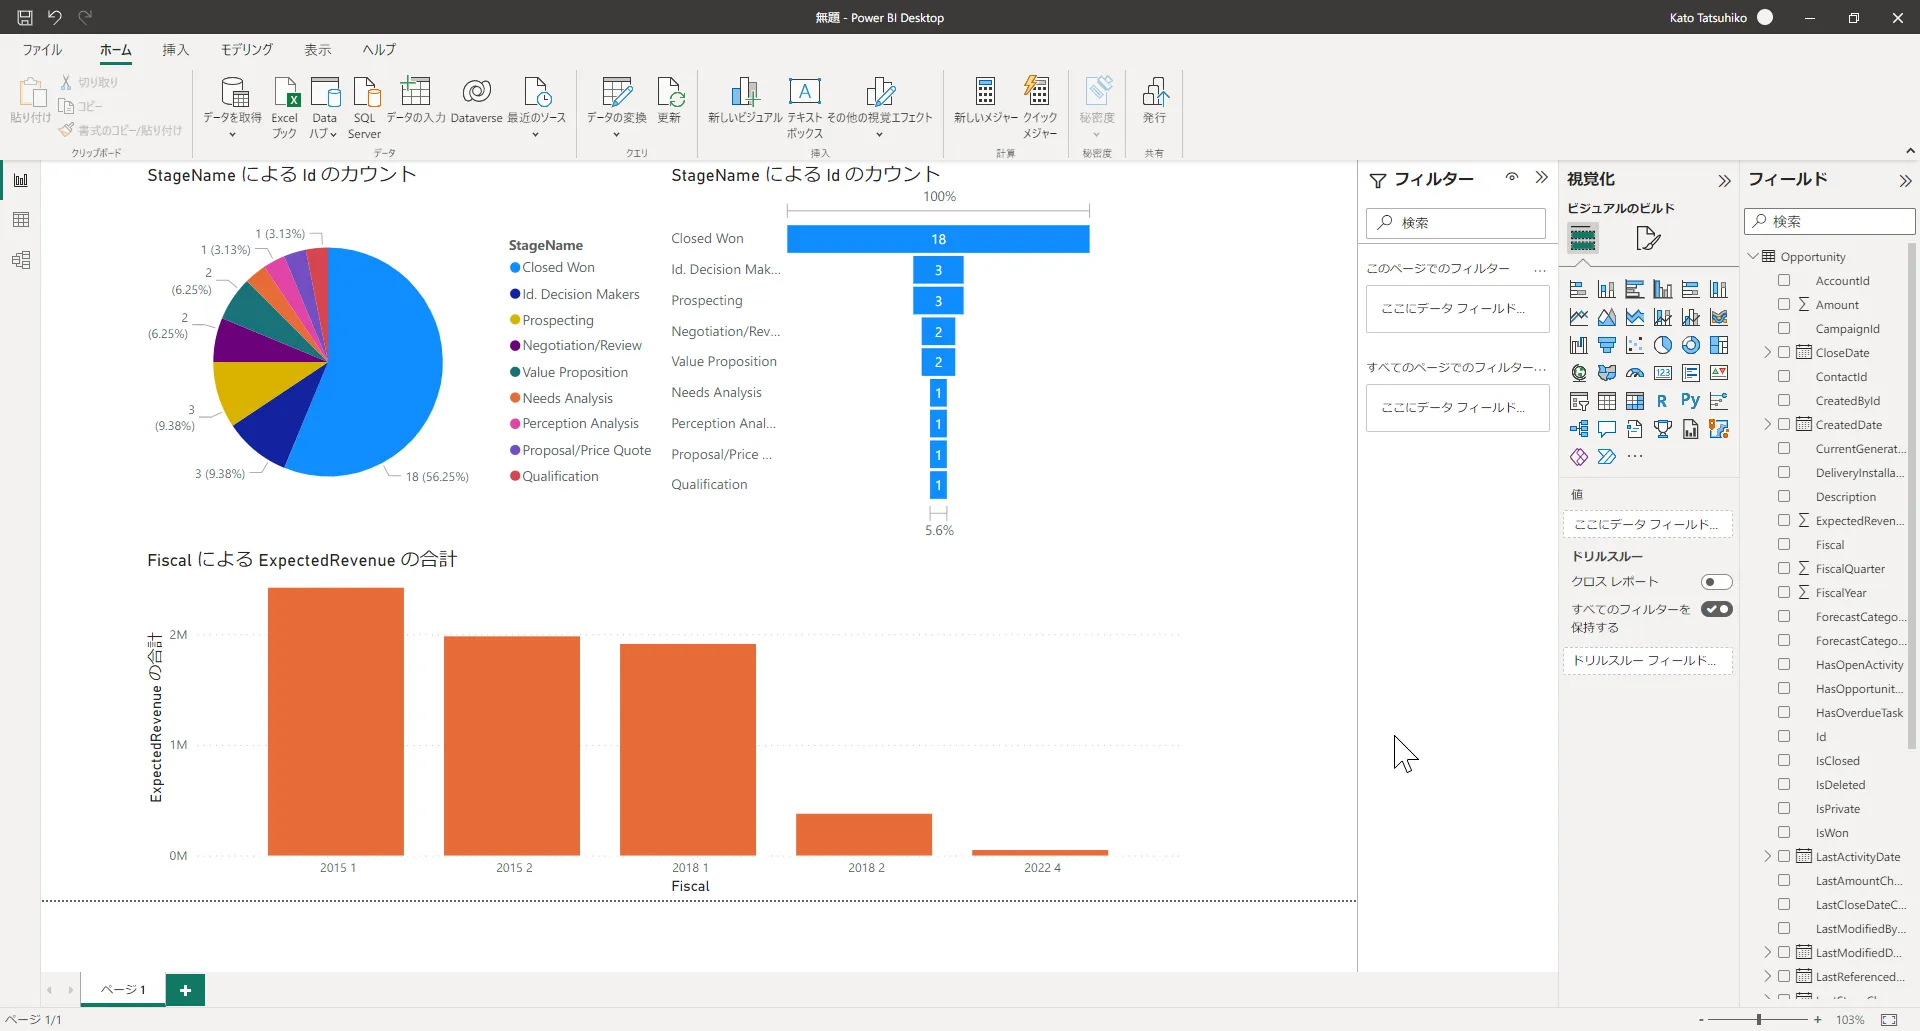
「更新」をクリックしてデータの変更をレポートに同期します。
データアプリケーションからAPI のデータへのSQL アクセス
以上で、CData API Server を使用してPower BI からAPI のデータに接続できるようになりました。これで、API のデータを複製することなく多くのデータをインポートしたり、新しい可視化やレポートを作成することができます。
オンプレミスのBI やレポート、ETL、その他のデータアプリケーションから、250を超えるSaaS、ビッグデータ、NoSQL データソース(API を含む)への直接のSQL データにアクセスするには、CData API Server のページにアクセスして無料トライアルをダウンロードしてください。