


データ可視化ソリューション「Reveal」から API に接続する方法

CData API Server を使って、Reveal にAPI データをフィードして、ビジュアライズを実現できます。コネクターによりリアルタイムデータ連携が可能になり、リフレッシュ操作で最新のデータを取得可能になります。この記事では、Reveal からAPI のデータに接続しビジュアライズする方法を説明します。
API Server の設定
以下のリンクからAPI Server の無償トライアルをスタートしたら、セキュアなAPI OData サービスを作成していきましょう。
API への接続
Reveal からAPI のデータを操作するには、まずyour API への接続を作成・設定します。
- API Server にログインして、「Connections」をクリック、さらに「接続を追加」をクリックします。
- 「接続を追加」をクリックして、データソースがAPI Server に事前にインストールされている場合は、一覧から「API」を選択します。
- 事前にインストールされていない場合は、コネクタを追加していきます。コネクタ追加の手順は以下の記事にまとめてありますので、ご確認ください。
CData コネクタの追加方法はこちら >> - それでは、API への接続設定を行っていきましょう!
-
To connect to your API, configure the following properties on the Global Settings page:
- In Authentication, select the Type and fill in the required properties
- In Headers, add the required HTTP headers for your API
- In Pagination, select the Type and fill in the required properties
After the configuring the global settings, navigate to the Tables to add tables. For each table you wish to add:
- Click "+ Add"
- Set the Name for the table
- Set Request URL to the API endpoint you wish to work with
")
- (Optional) In Parameters, add the required URL Parameters for your API endpoint
- (Optional) In Headers, add the required HTTP headers for the API endpoint
- In Table Data click " Configure"
- Review the response from the API and click "Next"
")
- Select which element to use as the Repeated Elements and which elements to use as Columns and click "Next"
")
- Preview the tabular model of the API response and click "Confirm"
")
- 接続情報の入力が完了したら、「保存およびテスト」をクリックします。
To connect to your API, configure the following properties on the Global Settings page:
- In Authentication, select the Type and fill in the required properties
- In Headers, add the required HTTP headers for your API
- In Pagination, select the Type and fill in the required properties
After the configuring the global settings, navigate to the Tables to add tables. For each table you wish to add:
- Click "+ Add"
- Set the Name for the table
- Set Request URL to the API endpoint you wish to work with
- (Optional) In Parameters, add the required URL Parameters for your API endpoint
- (Optional) In Headers, add the required HTTP headers for the API endpoint
- In Table Data click " Configure"
- Review the response from the API and click "Next"
- Select which element to use as the Repeated Elements and which elements to use as Columns and click "Next"
- Preview the tabular model of the API response and click "Confirm"
API Server のユーザー設定
次に、API Server 経由でAPI にアクセスするユーザーを作成します。「Users」ページでユーザーを追加・設定できます。やってみましょう。
- 「Users」ページで ユーザーを追加をクリックすると、「ユーザーを追加」ポップアップが開きます。
-
次に、「ロール」、「ユーザー名」、「権限」プロパティを設定し、「ユーザーを追加」をクリックします。

-
その後、ユーザーの認証トークンが生成されます。各ユーザーの認証トークンとその他の情報は「Users」ページで確認できます。

API 用のAPI エンドポイントの作成
ユーザーを作成したら、API のデータ用のAPI エンドポイントを作成していきます。
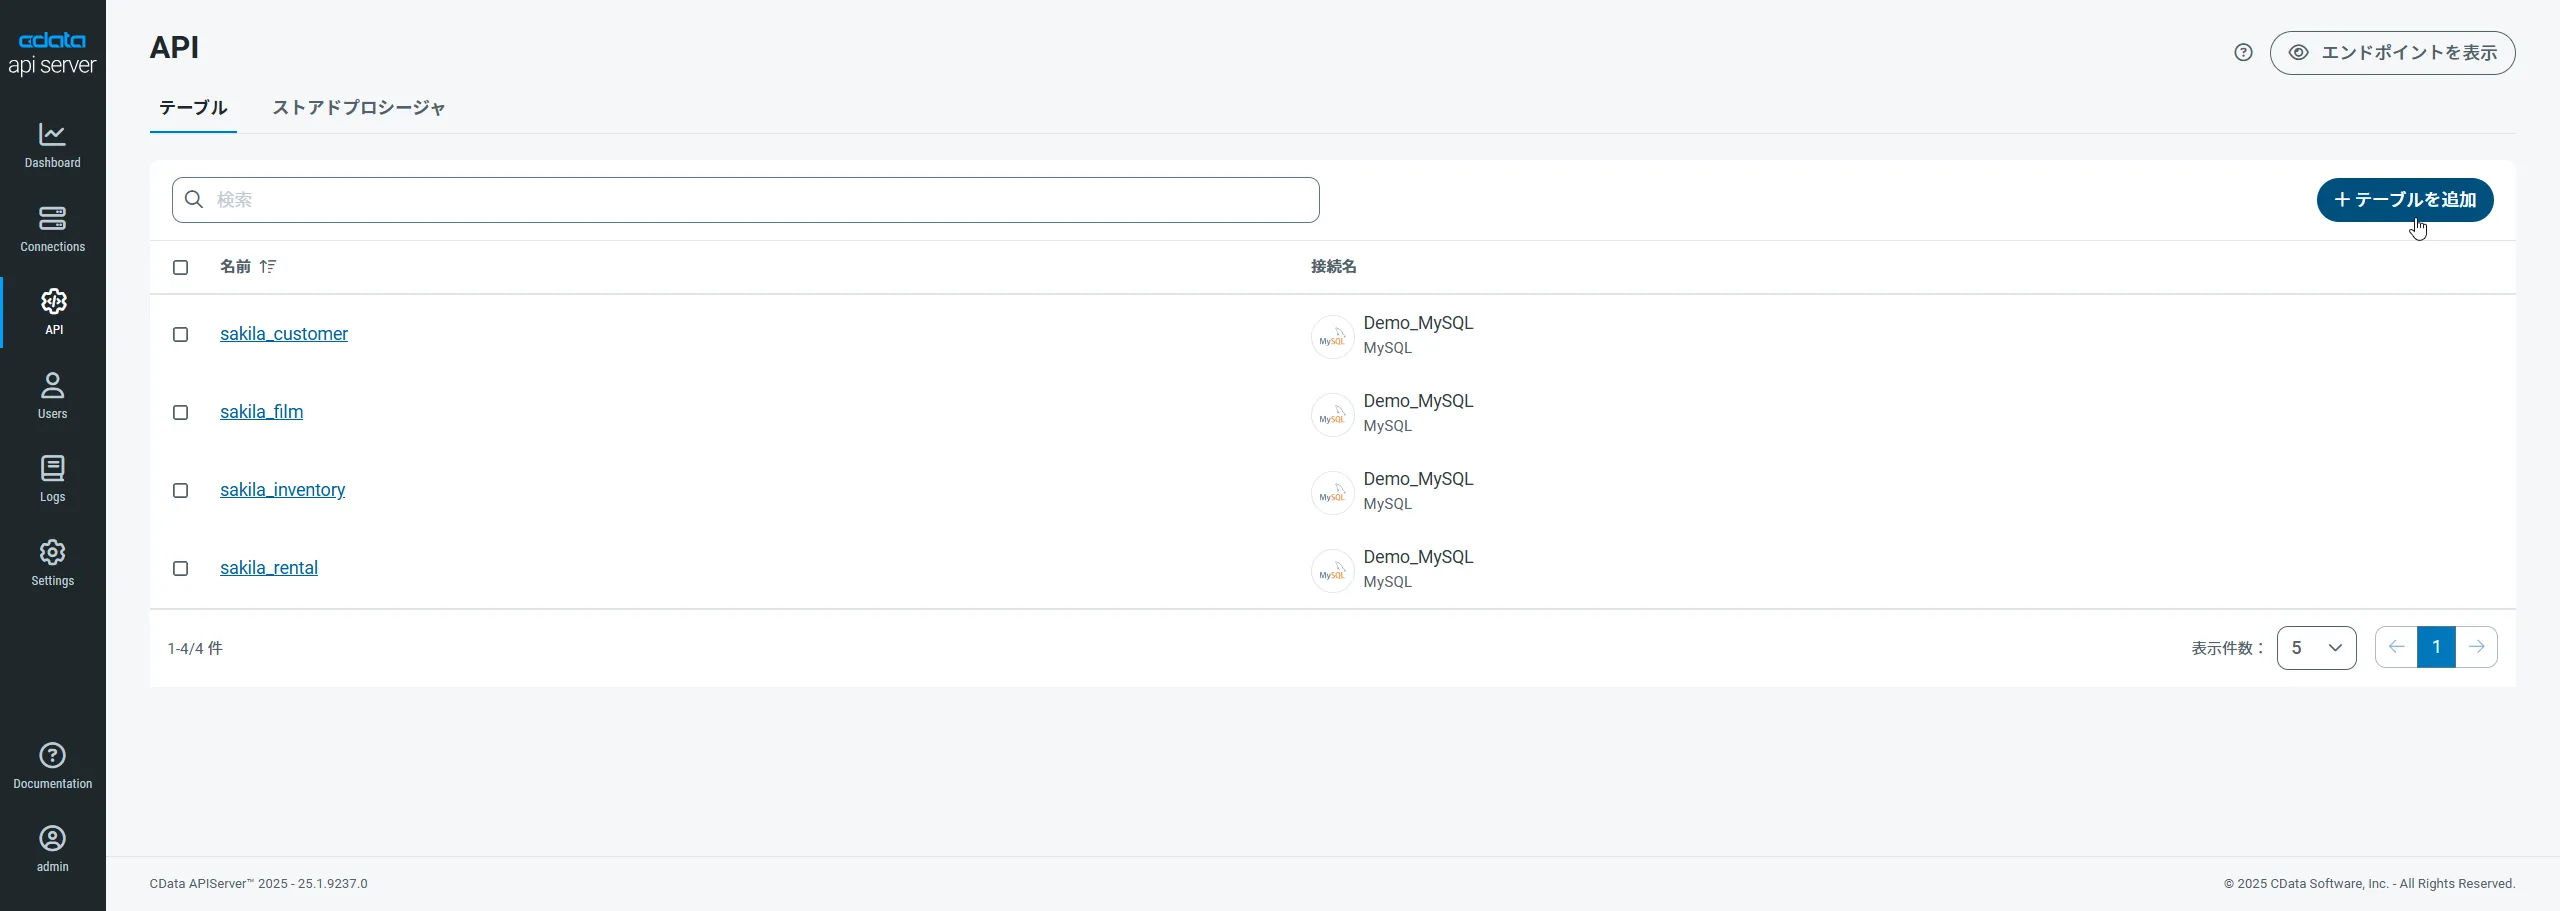
-
まず、「API」ページに移動し、
「 テーブルを追加」をクリックします。
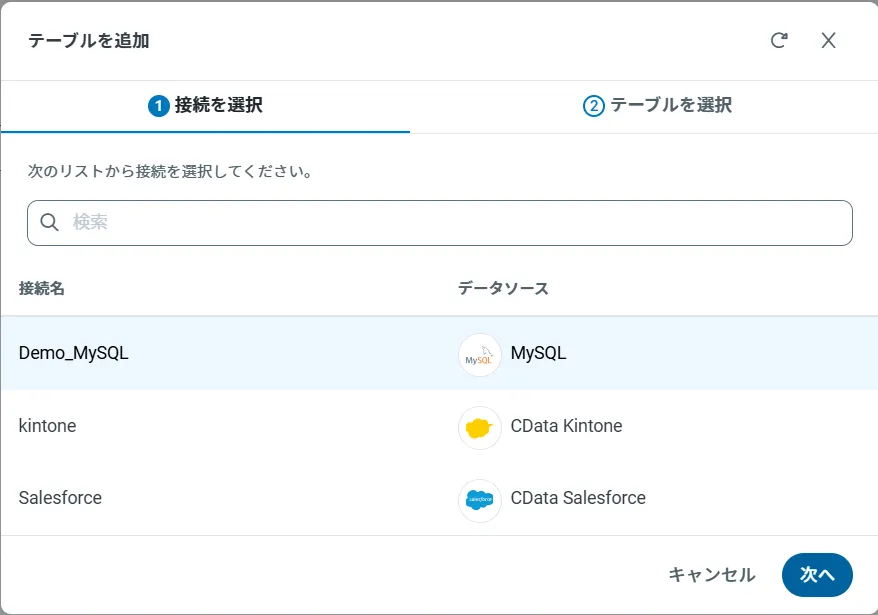
-
アクセスしたい接続を選択し、次へをクリックします。
-
接続を選択した状態で、各テーブルを選択して確認をクリックすることでエンドポイントを作成します。

OData のエンドポイントを取得
以上でAPI への接続を設定してユーザーを作成し、API Server でAPI データのAPI を追加しました。これで、OData 形式のAPI データをREST API で利用できます。API Server の「API」ページから、API のエンドポイントを表示およびコピーできます。

ダッシュボードの作成
それでは実際に可視化を行っていきます。「Reveal」ではダッシュボードという単位でいくつかのグラフを配置して、構成していきます。
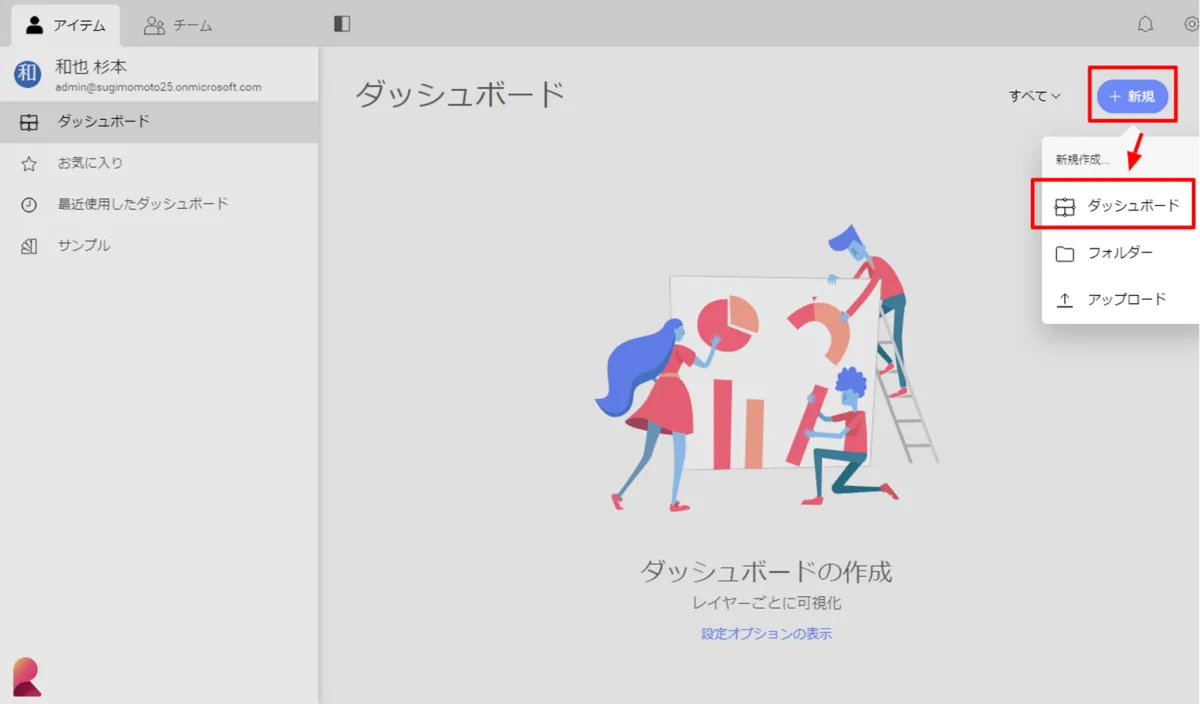
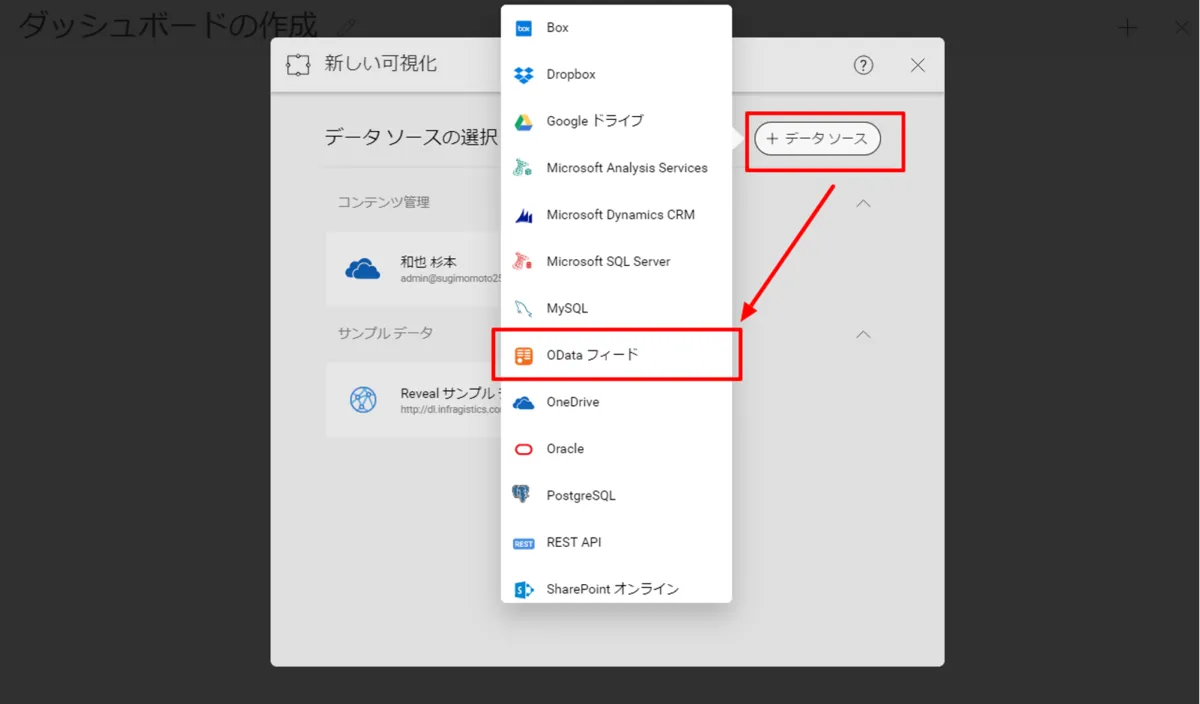
- Revealにログインし、「新規」→「ダッシュボード」をクリックします。
- データソースから「ODataフィード」を選択し
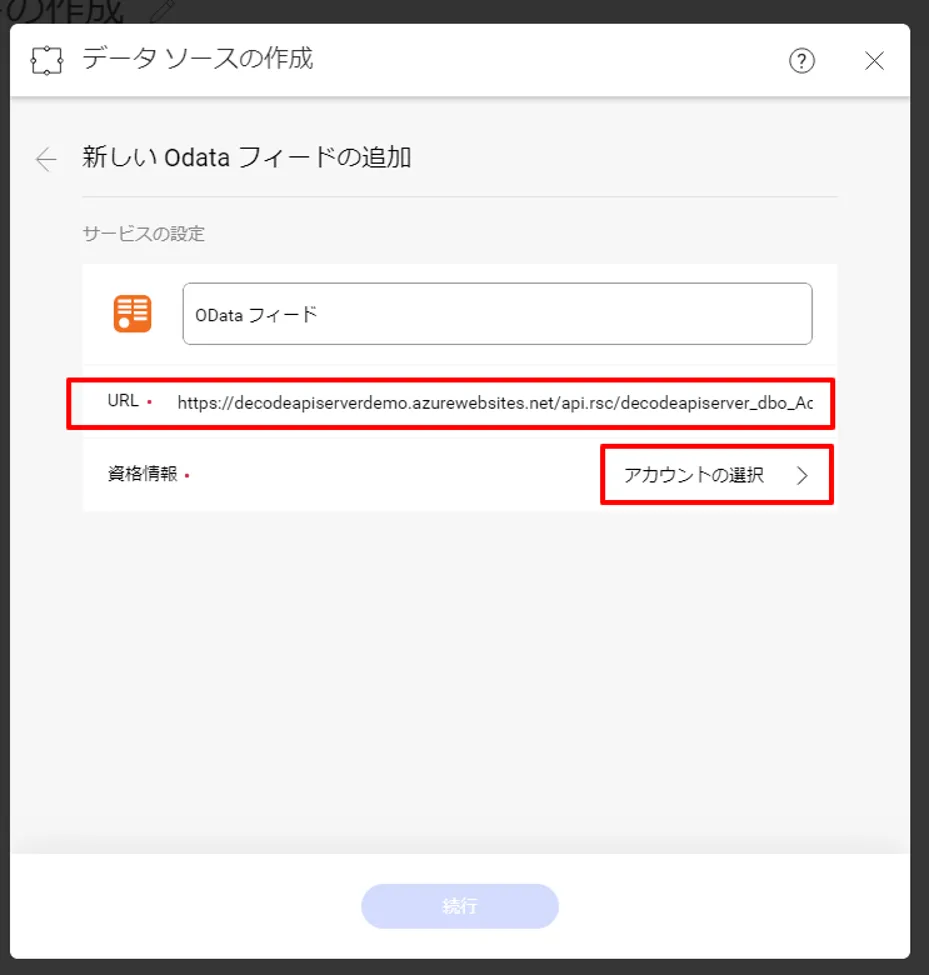
- API ServerのAPIエンドポイントURLを指定し、資格情報を入力します。 URLは「https://XXXXXXX/api.rsc/」といったように末尾が「api.rsc」で終わっているものを入力します。
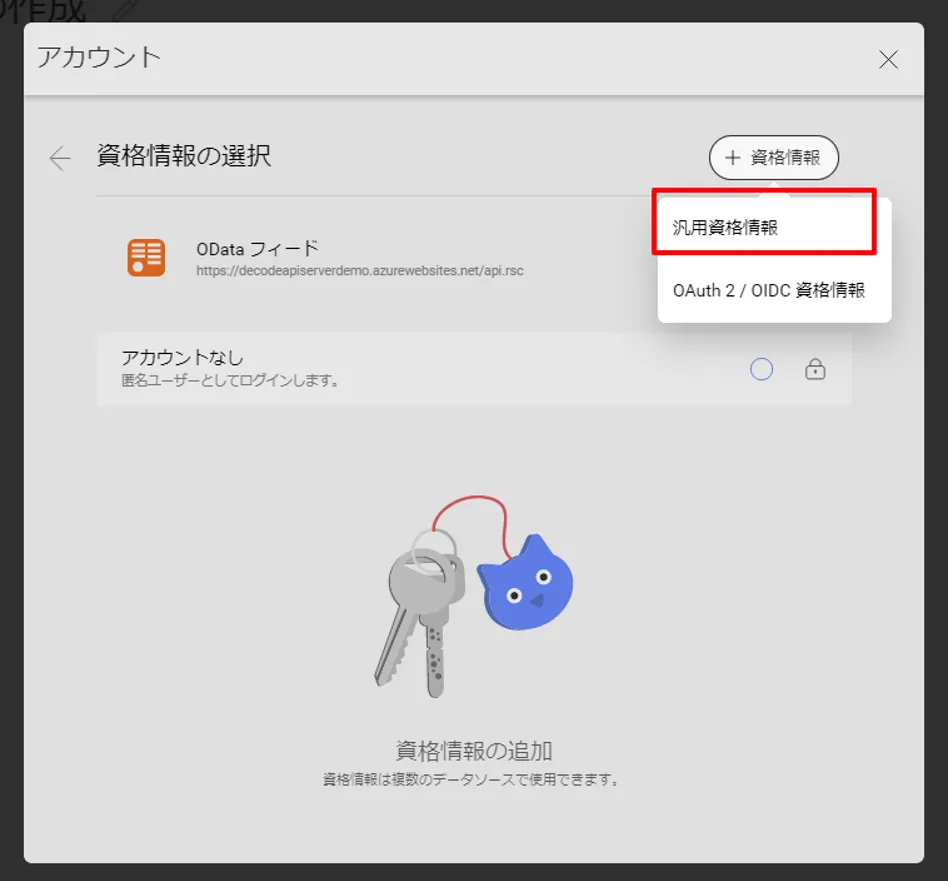
- 資格情報は「汎用資格情報」を選択し、
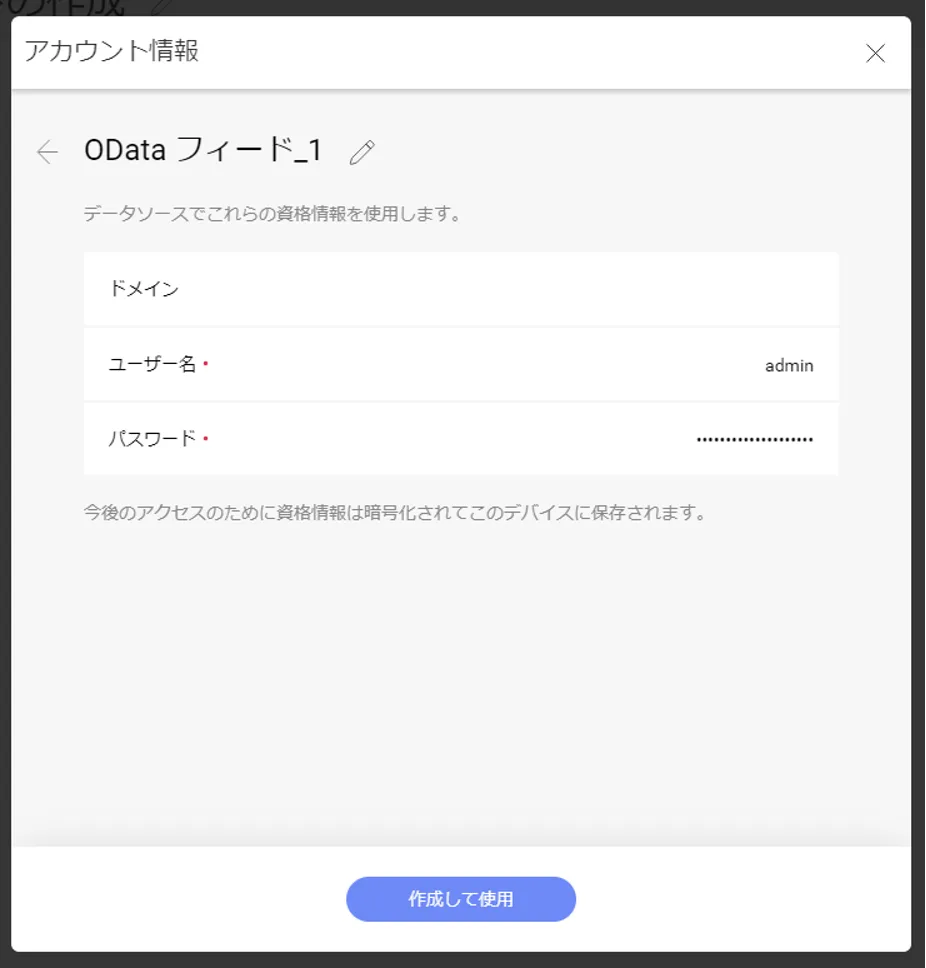
- あらかじめ作成しておいたAPI Serverのユーザー名と認証トークンをそれぞれ指定します。
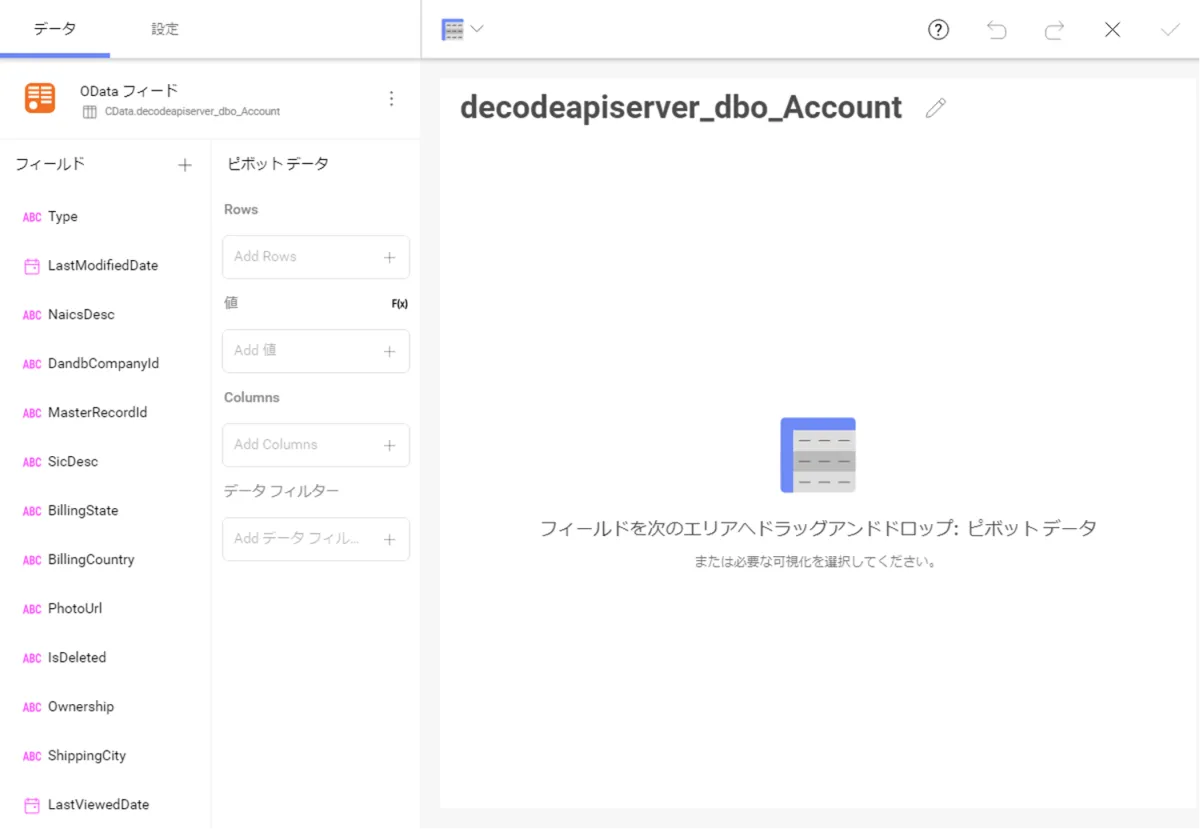
- 認証完了後、エンティティセットを選択する画面に移動するので、取得したい任意のエンティティセットを選択します。
- これでダッシュボードを作成する準備が整いました。あとは Reveal の機能を使って、API・API Serverから取得したデータを可視化・分析することができます。
- 以下のようなグラフを作成することができました。

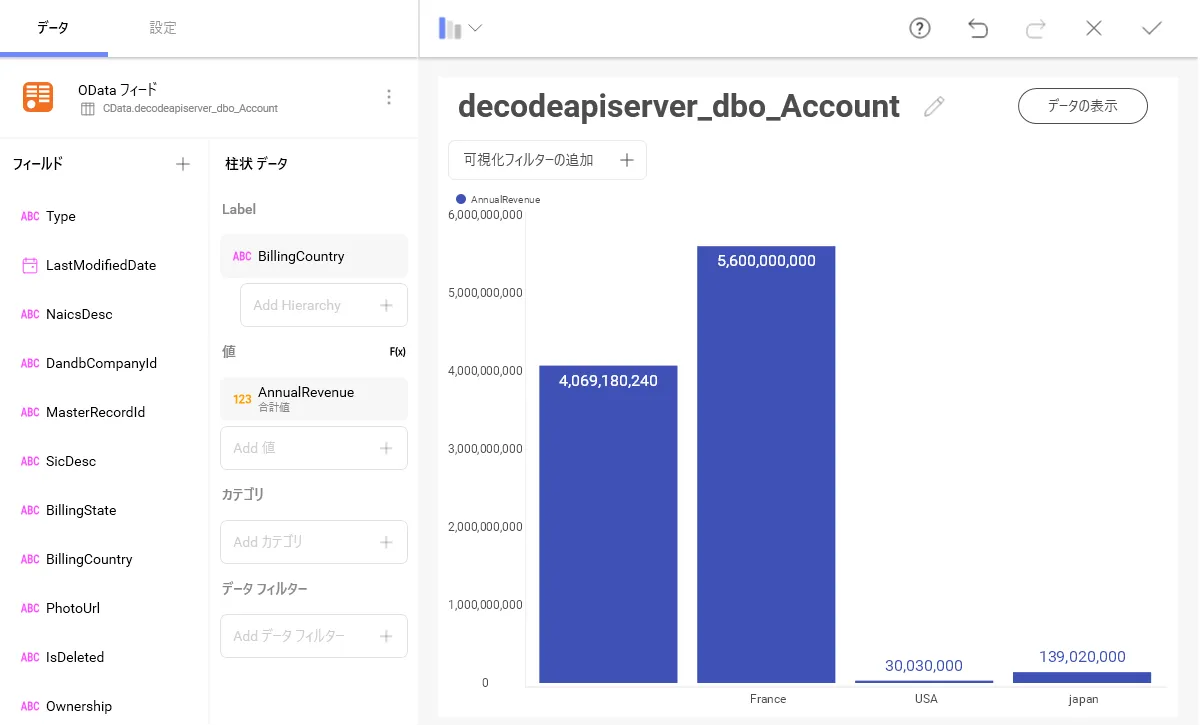
このように API 内のデータをAPI を書くことなく Reveal 上で処理することができるようになります。
おわりに
これで、リアルタイムAPI のデータから簡単なダッシュボードが作成できました。API (および150 を超えるほかのソース)からのOData フィードの作成方法の詳細については、API Server のページにアクセスしてください。30 日間無料トライアルをダウンロードしてOData API を使用するツールでAPI のデータをリアルタイムに活用しましょう。