


【ノーコード】SAP LumiraでAPI のOData フィードを取り込んでみる

CData API Server を使って、SAP Lumira でAPI に基づくビジュアライゼーションを作成できます。API Server により、リアルタイムデータへの接続が可能になります。ダッシュボードとレポートはオンデマンドで更新できます。この記事では、常に最新であるグラフを作成する方法を説明します。
API Server の設定
以下のリンクからAPI Server の無償トライアルをスタートしたら、セキュアなAPI OData サービスを作成していきましょう。
API への接続
Salesforce Connect からAPI のデータを操作するには、まずyour API への接続を作成・設定します。
- API Server にログインして、「Connections」をクリック、さらに「接続を追加」をクリックします。
- 「接続を追加」をクリックして、データソースがAPI Server に事前にインストールされている場合は、一覧から「API」を選択します。
- 事前にインストールされていない場合は、コネクタを追加していきます。コネクタ追加の手順は以下の記事にまとめてありますので、ご確認ください。
CData コネクタの追加方法はこちら >> - それでは、API への接続設定を行っていきましょう!
-
To connect to your API, configure the following properties on the Global Settings page:
- In Authentication, select the Type and fill in the required properties
- In Headers, add the required HTTP headers for your API
- In Pagination, select the Type and fill in the required properties
After the configuring the global settings, navigate to the Tables to add tables. For each table you wish to add:
- Click "+ Add"
- Set the Name for the table
- Set Request URL to the API endpoint you wish to work with
")
- (Optional) In Parameters, add the required URL Parameters for your API endpoint
- (Optional) In Headers, add the required HTTP headers for the API endpoint
- In Table Data click " Configure"
- Review the response from the API and click "Next"
")
- Select which element to use as the Repeated Elements and which elements to use as Columns and click "Next"
")
- Preview the tabular model of the API response and click "Confirm"
")
- 接続情報の入力が完了したら、「保存およびテスト」をクリックします。
To connect to your API, configure the following properties on the Global Settings page:
- In Authentication, select the Type and fill in the required properties
- In Headers, add the required HTTP headers for your API
- In Pagination, select the Type and fill in the required properties
After the configuring the global settings, navigate to the Tables to add tables. For each table you wish to add:
- Click "+ Add"
- Set the Name for the table
- Set Request URL to the API endpoint you wish to work with
- (Optional) In Parameters, add the required URL Parameters for your API endpoint
- (Optional) In Headers, add the required HTTP headers for the API endpoint
- In Table Data click " Configure"
- Review the response from the API and click "Next"
- Select which element to use as the Repeated Elements and which elements to use as Columns and click "Next"
- Preview the tabular model of the API response and click "Confirm"
API Server のユーザー設定
次に、API Server 経由でAPI にアクセスするユーザーを作成します。「Users」ページでユーザーを追加・設定できます。やってみましょう。
- 「Users」ページで ユーザーを追加をクリックすると、「ユーザーを追加」ポップアップが開きます。
-
次に、「ロール」、「ユーザー名」、「権限」プロパティを設定し、「ユーザーを追加」をクリックします。

-
その後、ユーザーの認証トークンが生成されます。各ユーザーの認証トークンとその他の情報は「Users」ページで確認できます。

API 用のAPI エンドポイントの作成
ユーザーを作成したら、API のデータ用のAPI エンドポイントを作成していきます。
-
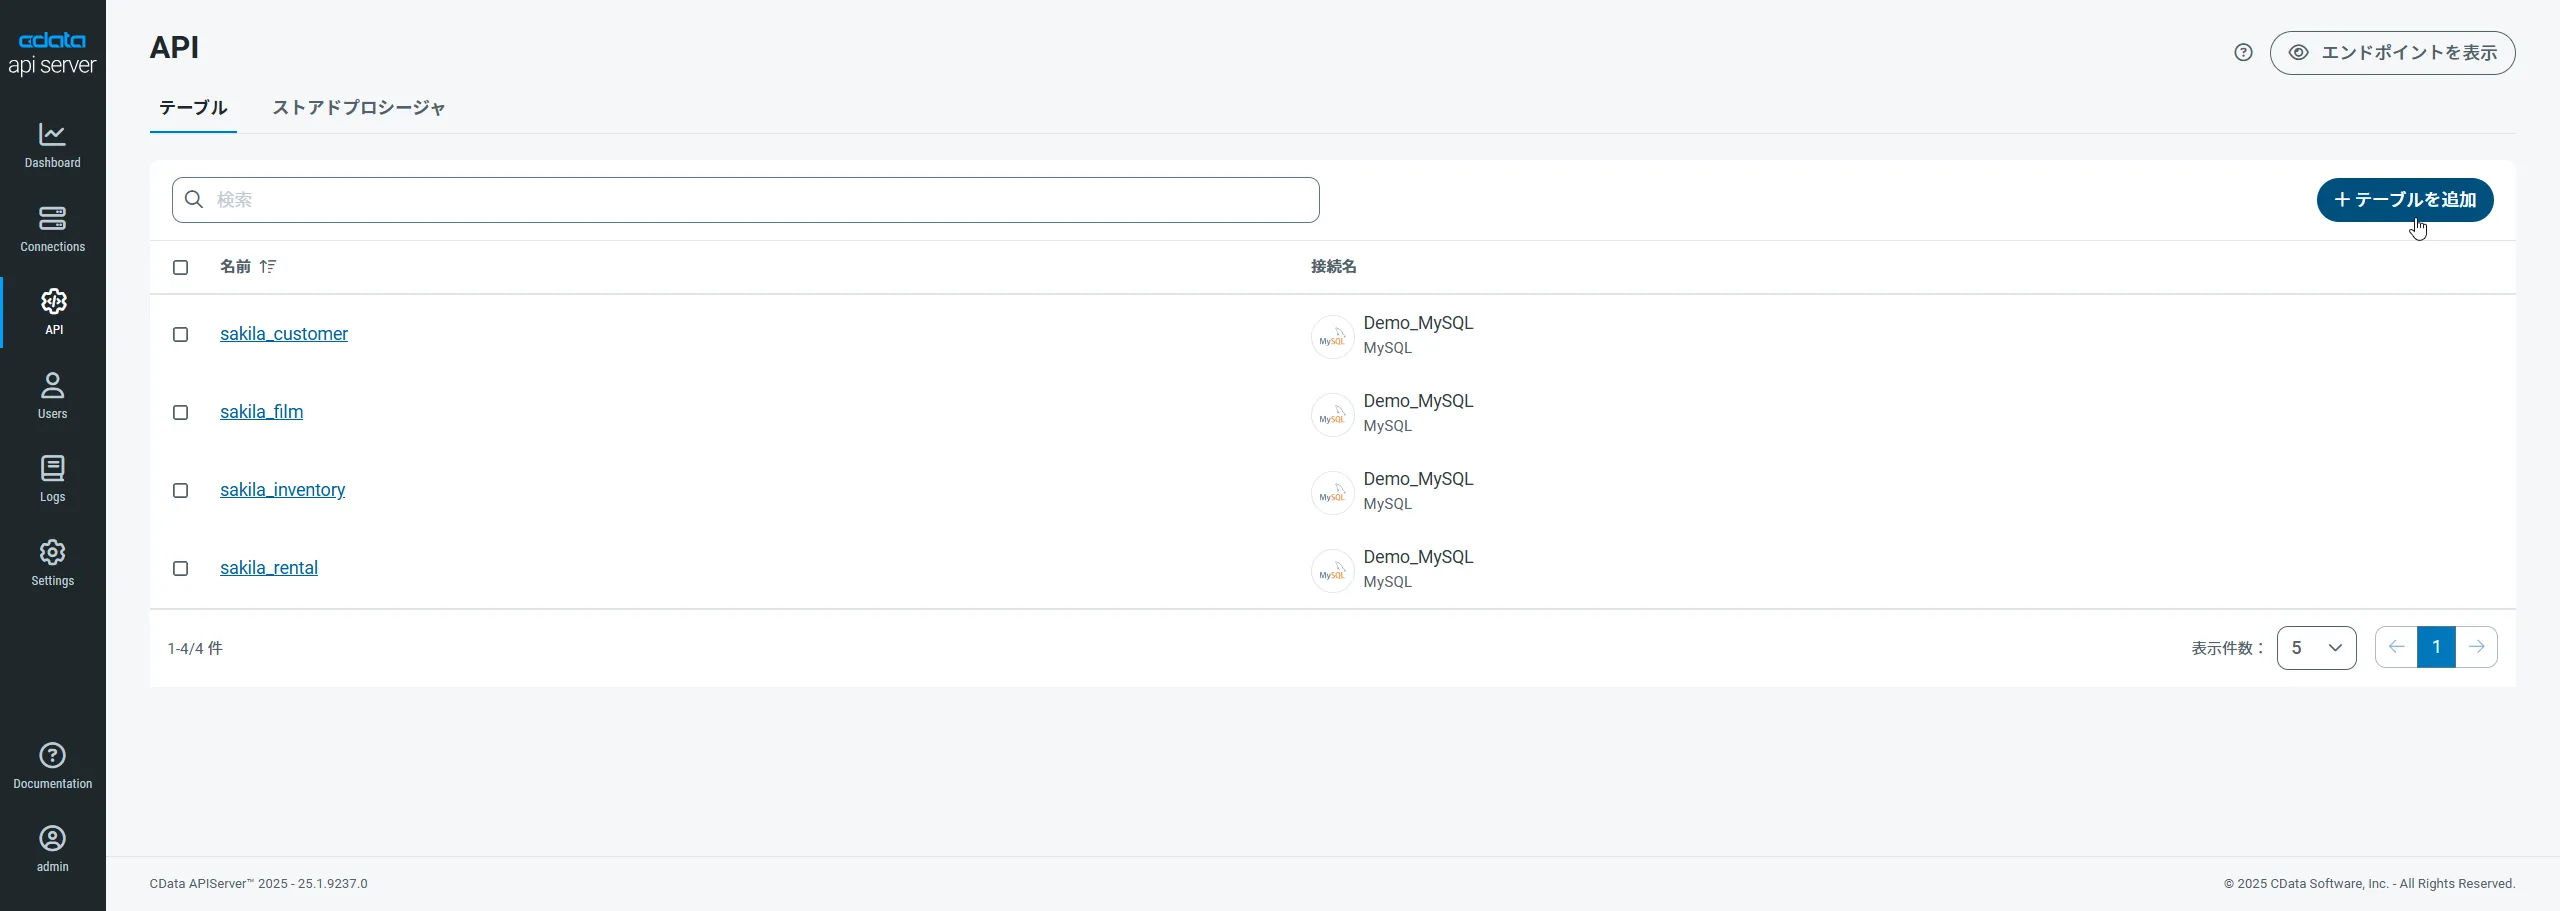
まず、「API」ページに移動し、
「 テーブルを追加」をクリックします。
-
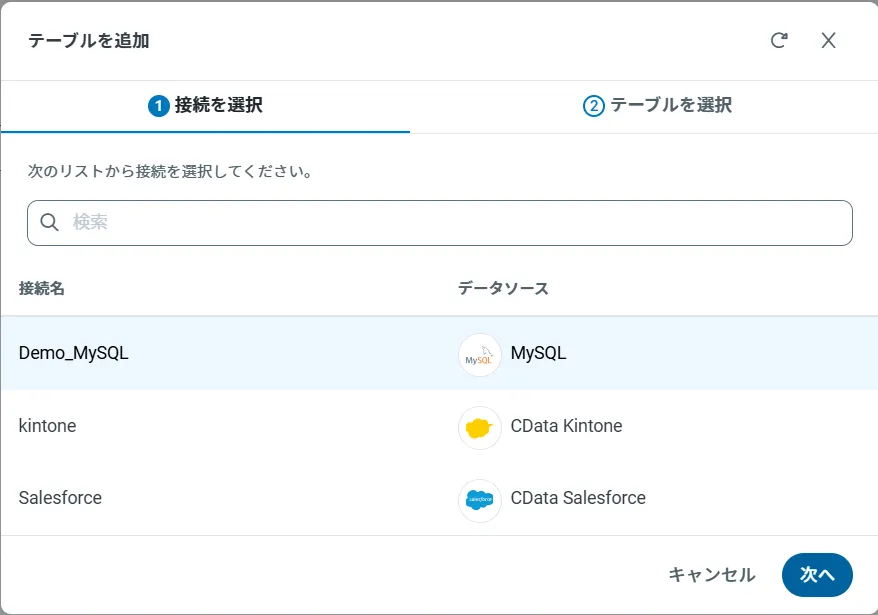
アクセスしたい接続を選択し、次へをクリックします。
-
接続を選択した状態で、各テーブルを選択して確認をクリックすることでエンドポイントを作成します。

OData のエンドポイントを取得
以上でAPI への接続を設定してユーザーを作成し、API Server でAPI データのAPI を追加しました。これで、OData 形式のAPI データをREST API で利用できます。API Server の「API」ページから、API のエンドポイントを表示およびコピーできます。

SAP Lumira からAPI への接続
以下のステップに従って、API をSAP Lumira に取得します。SQL クエリを実行するか、UI を使用できます。
- SAP Lumira で[File]->[New]->[Query with SQL]とクリックします。Add New Dataset ダイアログが表示されます。
- [Generic]セクションを展開し、[Generic OData 2.0 Connector]オプションをクリックします。
-
[Service Root URI]ボックスに、API Server のOData エンドポイントを入力します。URL は次の例のようになります。
https://your-server:8032/api.rsc
-
[User Name]と[Password]のボックスにAPI ユーザーのユーザー名と認証トークンを入力します。これらの資格情報は、HTTP 基本認証で使用されます。
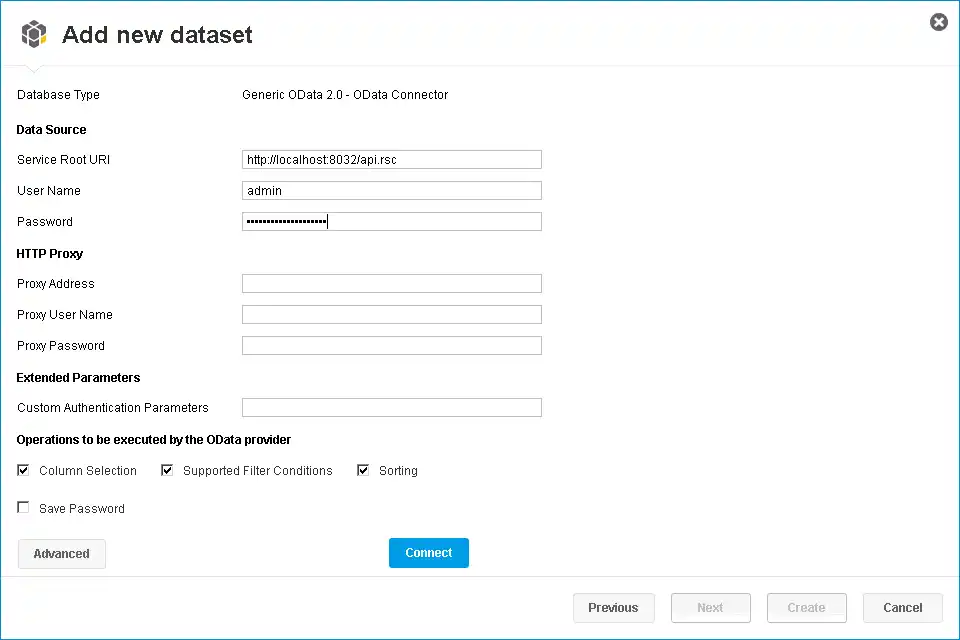
ツリーでエンティティを選択するか、SQL クエリを入力します。この記事では、API posts エンティティをインポートします。

-
[Connect]をクリックすると、SAP Lumira は対応するOData 要求を生成し、結果をメモリにロードします。その後、フィルタ、集計、要約関数など、SAP Lumira で使用可能な任意のデータ処理ツールを使用できます。
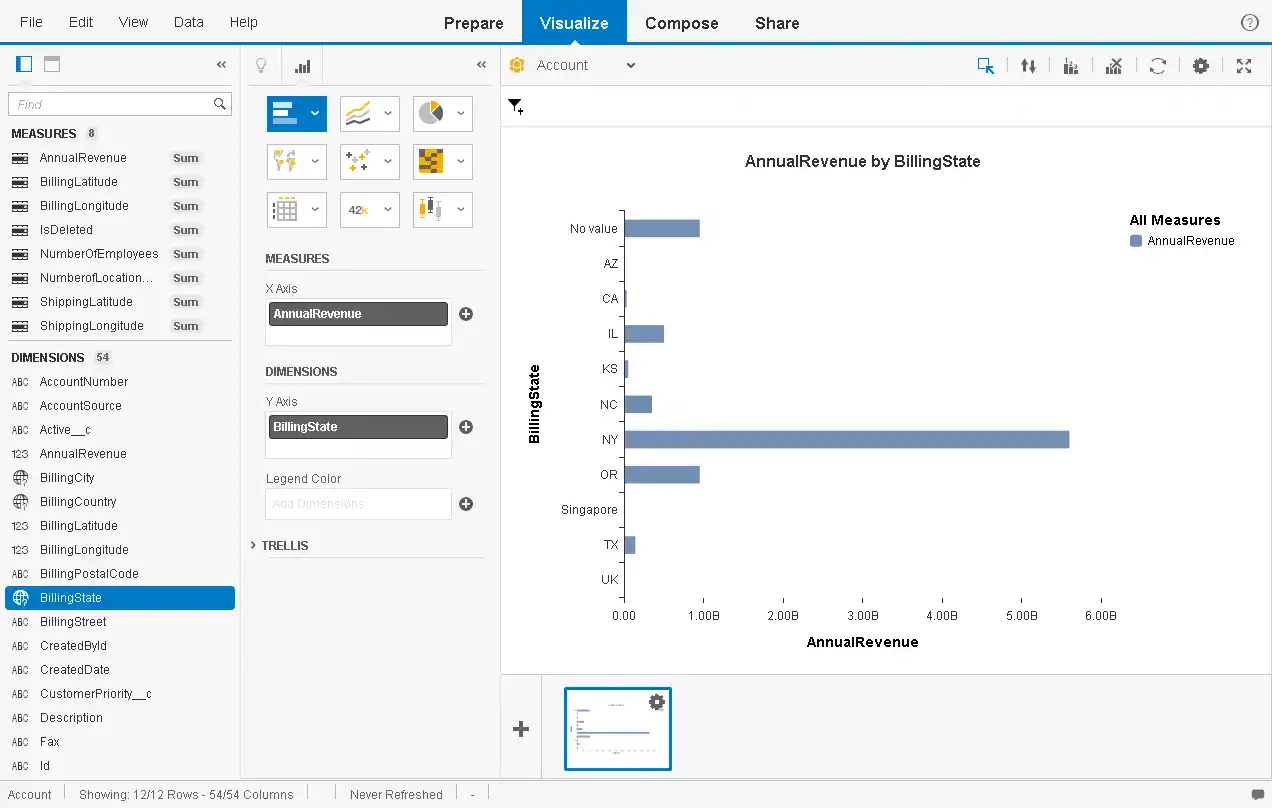
データのビジュアライゼーションを作成
データをインポートした後、[Visualize]ルームでデータのビジュアライゼーションを作成できます。以下のステップに従って、基本グラフを作成します。
[Measures and Dimensions]ペインで、メジャーとディメンションを[Visualization Tools]ペインの[x-axis]フィールドと[y-axis]フィールドにドラッグします。SAP Lumira は、API Server のメタデータサービスからディメンションとメジャーを自動的に検出します。
デフォルトでは、SUM 関数はすべてのメジャーに適用されます。メジャーの横にある歯車のアイコンをクリックしてデフォルトの要約を変更します。
- [Visualization Tools]ペインで、グラフの種類を選択します。
- [Chart Canvas]ペインで、フィルタを適用し、メジャーで並べ替え、ランキングを追加して現在のAPI でグラフを更新します。