


Klipfolio のデータをDevExpress Data Grid にデータバインドする。

Klipfolio 用の CData ADO.NET プロバイダーはサードパーティーコントロールで使うことのできる通常のADO.NET データベースアクセスコンポーネントを実装しています。データバインドするための通常のADO.NET プロセスに従うことで、UI コントロールから実データへの双方向アクセスを可能にします。 この記事では、CData を使ってDevExpress Windows Forms とウェブコントロールにデータバインドする方法を説明します。ここでは、最新のデータを表示するチャートにデータバインドします。
まず、Profile 接続プロパティにKlipfolio プロファイルのディスク上の場所を設定します(例:C:\profiles\Klipfolio.apip)。次に、ProfileSettings 接続プロパティにKlipfolio の接続文字列を設定します(以下を参照)。
Klipfolio API プロファイル設定
Klipfolio に認証するには、API Key を提供する必要があります。API Key は、Klipfolio Dashboard アプリのMy Profile ページから、または管理者の場合はUsers から生成できます(user.manage 権限が必要です)。ProfileSettings プロパティにAPI Key を設定して接続します。
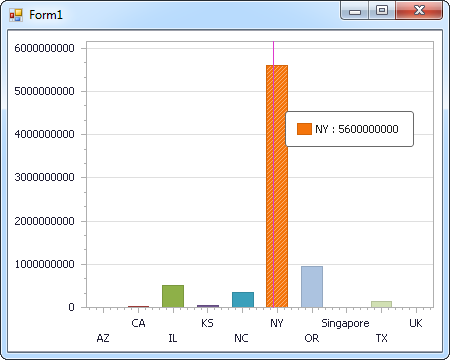
Windows Forms コントロール
下のコードでは、Klipfolio でDevExpress のチャートに追加する方法を説明します。APIDataAdapter はチャートコントロールのSeries プロパティにバインドします。コントロールのDiagram プロパティはx 軸とy 軸をカラム名として定義します。
using (APIConnection connection = new APIConnection(
"Profile=C:\profiles\Klipfolio.apip;ProfileSettings='APIKey=your_api_key';")) {
  APIDataAdapter dataAdapter = new APIDataAdapter(
  "SELECT Id, Name FROM DataSources WHERE IsDynamic = 'true'", connection);

  DataTable table = new DataTable();
  dataAdapter.Fill(table);
  DevExpress.XtraCharts.Series series = new DevExpress.XtraCharts.Series();
  chartControl1.Series.Add(series);
  DataTable table = new DataTable();
  series.ValueDataMembers.AddRange(new string[] { "Name" });
  series.ArgumentScaleType = DevExpress.XtraCharts.ScaleType.Qualitative;
  series.ArgumentDataMember = "Id";
  series.ValueScaleType = DevExpress.XtraCharts.ScaleType.Numerical;
  chartControl1.Legend.Visibility = DevExpress.Utils.DefaultBoolean.False;
  ((DevExpress.XtraCharts.SideBySideBarSeriesView)series.View).ColorEach = true;
}
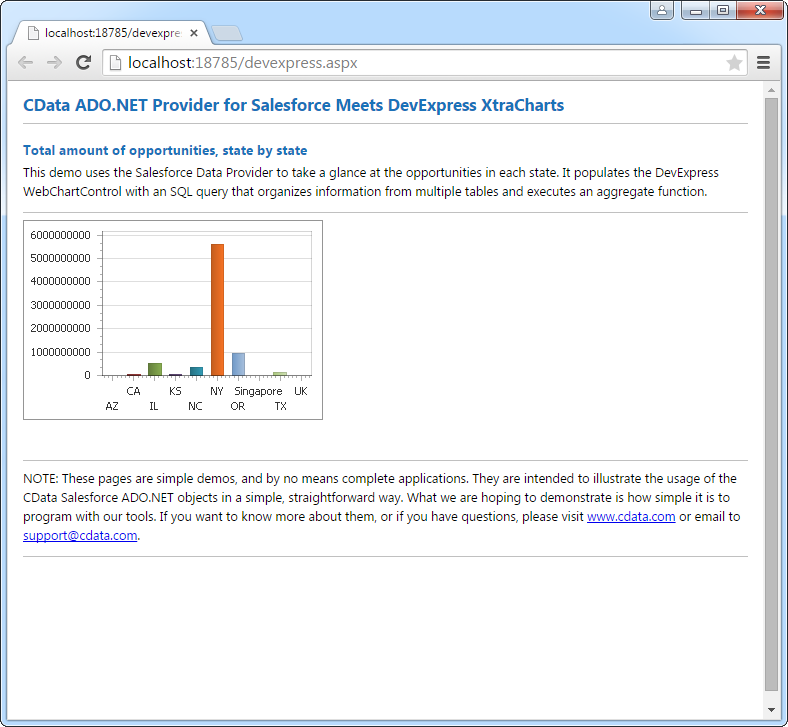
Web コントロール
下のコードではKlipfolio でDevExpress Web を操作するための設定方法を説明します。APIDataAdapter はチャートのSeries プロパティにバインドします。Diagram プロパティはx 軸とy 軸をカラム名として定義します。
using DevExpress.XtraCharts;

using (APIConnection connection = new APIConnection(
"Profile=C:\profiles\Klipfolio.apip;ProfileSettings='APIKey=your_api_key';"))
{
  APIDataAdapter APIDataAdapter1 = new APIDataAdapter("SELECT Id, Name FROM DataSources WHERE IsDynamic = 'true'", connection);
  DataTable table = new DataTable();
  APIDataAdapter1.Fill(table);
  DevExpress.XtraCharts.Series series = new Series("Series1", ViewType.Bar);
  WebChartControl1.Series.Add(series);
  DataTable table = new DataTable();
  series.ValueDataMembers.AddRange(new string[] { "Name" });
  series.ArgumentScaleType = ScaleType.Qualitative;
  series.ArgumentDataMember = "Id";
  series.ValueScaleType = ScaleType.Numerical;
  ((DevExpress.XtraCharts.SideBySideBarSeriesView)series.View).ColorEach = true;
}