


Printful のデータをDevExpress Data Grid にデータバインドする。

Printful 用の CData ADO.NET プロバイダーはサードパーティーコントロールで使うことのできる通常のADO.NET データベースアクセスコンポーネントを実装しています。データバインドするための通常のADO.NET プロセスに従うことで、UI コントロールから実データへの双方向アクセスを可能にします。 この記事では、CData を使ってDevExpress Windows Forms とウェブコントロールにデータバインドする方法を説明します。ここでは、最新のデータを表示するチャートにデータバインドします。
まず、Profile 接続プロパティにPrintful プロファイルのディスク上の場所を設定します(例:C:\profiles\Printful.apip)。次に、ProfileSettings 接続プロパティにPrintful の接続文字列を設定します(以下を参照)。
Printful API プロファイル設定
Printful に認証するには、API Key を提供する必要があります。API Key を取得するには、まず「Settings」に移動し、次に「Stores」に移動します。接続するStore を選択し、「Add API Access」ボタンをクリックしてAPI Key を生成します。ProfileSettings プロパティにAPI Key を設定して接続します。
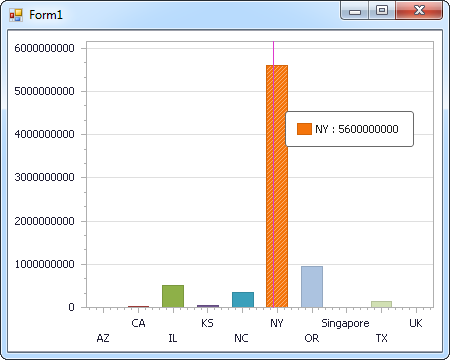
Windows Forms コントロール
下のコードでは、Printful でDevExpress のチャートに追加する方法を説明します。APIDataAdapter はチャートコントロールのSeries プロパティにバインドします。コントロールのDiagram プロパティはx 軸とy 軸をカラム名として定義します。
using (APIConnection connection = new APIConnection(
"Profile=C:\profiles\Printful.apip;ProfileSettings='APIKey=my_api_key';")) {
  APIDataAdapter dataAdapter = new APIDataAdapter(
  "SELECT Id, Store FROM Orders WHERE Status = 'inprocess'", connection);

  DataTable table = new DataTable();
  dataAdapter.Fill(table);
  DevExpress.XtraCharts.Series series = new DevExpress.XtraCharts.Series();
  chartControl1.Series.Add(series);
  DataTable table = new DataTable();
  series.ValueDataMembers.AddRange(new string[] { "Store" });
  series.ArgumentScaleType = DevExpress.XtraCharts.ScaleType.Qualitative;
  series.ArgumentDataMember = "Id";
  series.ValueScaleType = DevExpress.XtraCharts.ScaleType.Numerical;
  chartControl1.Legend.Visibility = DevExpress.Utils.DefaultBoolean.False;
  ((DevExpress.XtraCharts.SideBySideBarSeriesView)series.View).ColorEach = true;
}
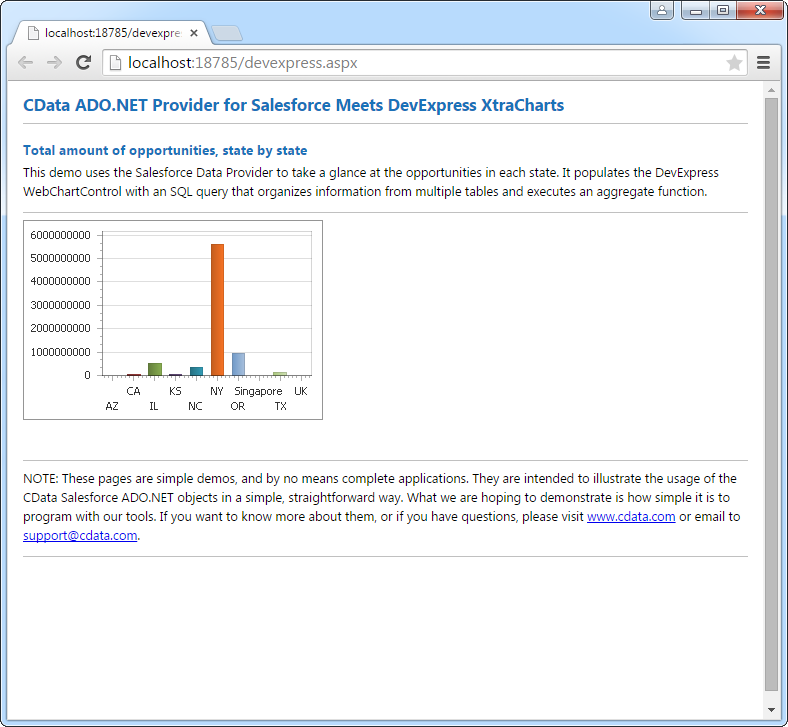
Web コントロール
下のコードではPrintful でDevExpress Web を操作するための設定方法を説明します。APIDataAdapter はチャートのSeries プロパティにバインドします。Diagram プロパティはx 軸とy 軸をカラム名として定義します。
using DevExpress.XtraCharts;

using (APIConnection connection = new APIConnection(
"Profile=C:\profiles\Printful.apip;ProfileSettings='APIKey=my_api_key';"))
{
  APIDataAdapter APIDataAdapter1 = new APIDataAdapter("SELECT Id, Store FROM Orders WHERE Status = 'inprocess'", connection);
  DataTable table = new DataTable();
  APIDataAdapter1.Fill(table);
  DevExpress.XtraCharts.Series series = new Series("Series1", ViewType.Bar);
  WebChartControl1.Series.Add(series);
  DataTable table = new DataTable();
  series.ValueDataMembers.AddRange(new string[] { "Store" });
  series.ArgumentScaleType = ScaleType.Qualitative;
  series.ArgumentDataMember = "Id";
  series.ValueScaleType = ScaleType.Numerical;
  ((DevExpress.XtraCharts.SideBySideBarSeriesView)series.View).ColorEach = true;
}