Zoho Recruit のデータをDevExpress Data Grid にデータバインドする。

CData API Driver for ADO.NET は、サードパーティ製コントロールと組み合わせて使える標準的なADO.NET データアクセスコンポーネントを備えています。通常のADO.NET データバインドの手順に沿って進めるだけで、UI コントロールからリアルタイムデータへの双方向アクセスを実現できます。この記事では、CData のコンポーネントを使って DevExpress UI コントロール(Windows Forms およびWeb コントロール) にデータバインドする方法を紹介します。今回は、リアルタイムのデータを可視化するチャートにデータバインドしていきます。
ZohoRecruit への認証では、OAuth 標準を使って自分のデータに接続したり、他のユーザーが各自のデータに接続できるようにしたりできます。
OAuth 認証の設定
まず、ZohoRecruit に OAuth アプリケーションを登録する必要があります。登録するには、Zoho Developer Console に移動して、新しい Client(Server-based application)を追加し、有効な OAuth リダイレクト URL を設定します。OAuth アプリケーションには client id と client secret が割り当てられます。さらに、該当する Domain(.com、.eu、.in、.com.cn、または .jp)を設定する必要があります。デフォルトは .com です。
以下の接続プロパティを設定して接続を確立してください:
- AuthScheme:OAuth に設定します。
- InitiateOAuth:GETANDREFRESH に設定します。InitiateOAuth を使うと、OAuthAccessToken を取得するプロセスを管理できます。
- OAuthClientId:アプリ設定で指定された client_id に設定します。
- OAuthClientSecret:アプリ設定で指定された client_secret に設定します。
- CallbackURL:アプリ設定で指定されたリダイレクト URI に設定します。
- Domain:ProfileSettings に設定して、ZohoRecruit アカウントのドメイン(例:.com、.eu、.in、.com.cn、.jp)を指定します。
接続文字列の例:
Profile=C:\profiles\ZohoRecruit.apip;ProfileSettings='Domain=.com';AuthScheme=OAuth;InitiateOAuth=GETANDREFRESH;OAuthClientId=your_client_id;OAuthClientSecret=your_client_secret;CallbackUrl=your_callback_url;
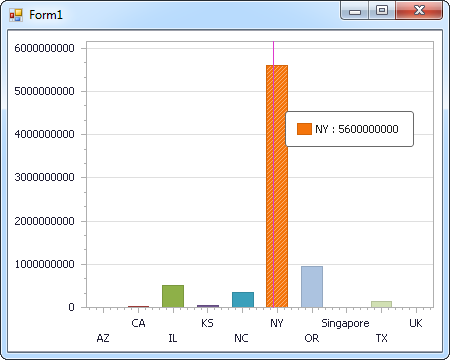
Windows Forms コントロール
下のコードでは、Zoho Recruit でDevExpress のチャートに追加する方法を説明します。APIDataAdapter はチャートコントロールのSeries プロパティにバインドします。コントロールのDiagram プロパティはx 軸とy 軸をカラム名として定義します。
using (APIConnection connection = new APIConnection(
"Profile=C:\profiles\ZohoRecruit.apip;ProfileSettings='Domain=.com';AuthScheme=OAuth;InitiateOAuth=GETANDREFRESH;OAuthClientId=your_client_id;OAuthClientSecret=your_client_secret;CallbackUrl=your_callback_url;")) {
  APIDataAdapter dataAdapter = new APIDataAdapter(
  "SELECT ,  FROM Attachments WHERE Module = 'Candidates'", connection);

  DataTable table = new DataTable();
  dataAdapter.Fill(table);
  DevExpress.XtraCharts.Series series = new DevExpress.XtraCharts.Series();
  chartControl1.Series.Add(series);
  DataTable table = new DataTable();
  series.ValueDataMembers.AddRange(new string[] { "" });
  series.ArgumentScaleType = DevExpress.XtraCharts.ScaleType.Qualitative;
  series.ArgumentDataMember = "";
  series.ValueScaleType = DevExpress.XtraCharts.ScaleType.Numerical;
  chartControl1.Legend.Visibility = DevExpress.Utils.DefaultBoolean.False;
  ((DevExpress.XtraCharts.SideBySideBarSeriesView)series.View).ColorEach = true;
}
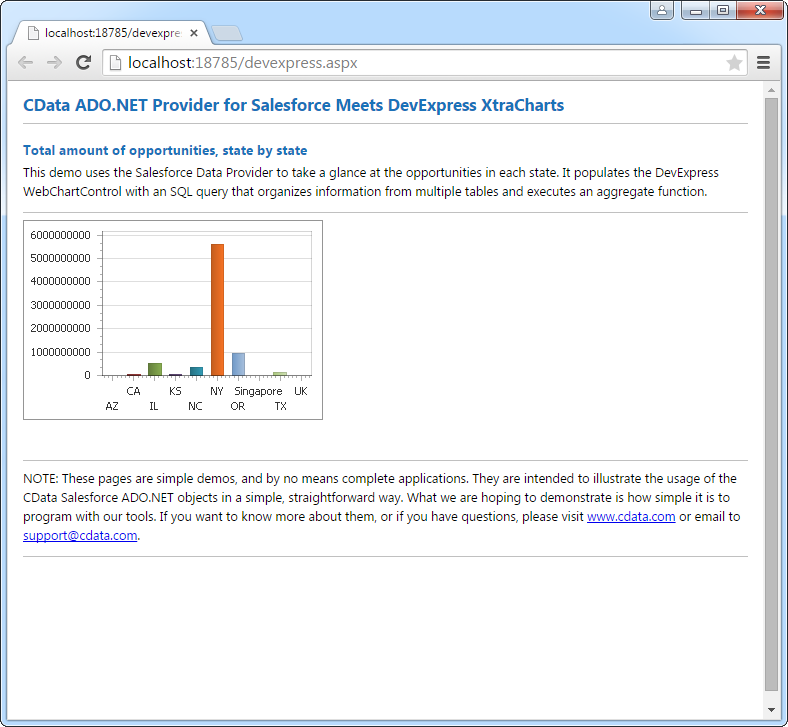
Web コントロール
下のコードではZoho Recruit でDevExpress Web を操作するための設定方法を説明します。APIDataAdapter はチャートのSeries プロパティにバインドします。Diagram プロパティはx 軸とy 軸をカラム名として定義します。
using DevExpress.XtraCharts;

using (APIConnection connection = new APIConnection(
"Profile=C:\profiles\ZohoRecruit.apip;ProfileSettings='Domain=.com';AuthScheme=OAuth;InitiateOAuth=GETANDREFRESH;OAuthClientId=your_client_id;OAuthClientSecret=your_client_secret;CallbackUrl=your_callback_url;"))
{
  APIDataAdapter APIDataAdapter1 = new APIDataAdapter("SELECT ,  FROM Attachments WHERE Module = 'Candidates'", connection);
  DataTable table = new DataTable();
  APIDataAdapter1.Fill(table);
  DevExpress.XtraCharts.Series series = new Series("Series1", ViewType.Bar);
  WebChartControl1.Series.Add(series);
  DataTable table = new DataTable();
  series.ValueDataMembers.AddRange(new string[] { "" });
  series.ArgumentScaleType = ScaleType.Qualitative;
  series.ArgumentDataMember = "";
  series.ValueScaleType = ScaleType.Numerical;
  ((DevExpress.XtraCharts.SideBySideBarSeriesView)series.View).ColorEach = true;
}