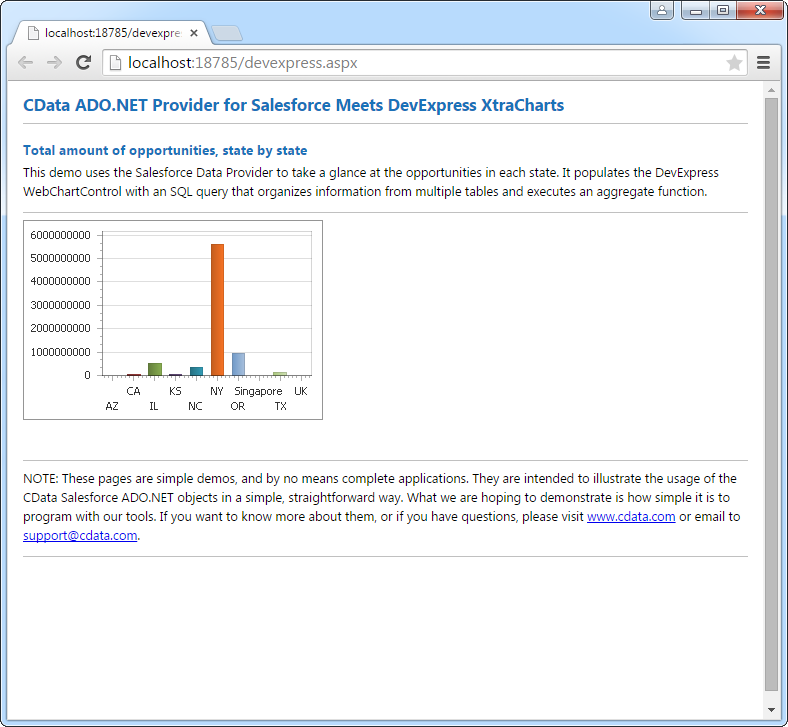



Freshservice のデータをDevExpress Data Grid にデータバインドする。

CData API Driver for ADO.NET は、サードパーティ製コントロールと組み合わせて使える標準的なADO.NET データアクセスコンポーネントを備えています。通常のADO.NET データバインドの手順に沿って進めるだけで、UI コントロールからリアルタイムデータの取得・表示を実現できます。この記事では、CData のコンポーネントを使って DevExpress UI コントロール(Windows Forms およびWeb コントロール) にデータバインドする方法を紹介します。今回は、リアルタイムのデータを可視化するチャートにデータバインドしていきます。
まず、Profile 接続プロパティをディスク上の Freshservice プロファイルの場所に設定します(例:C:\profiles\Freshservice.apip)。次に、ProfileSettings 接続プロパティを Freshservice の接続文字列に設定します(以下を参照)。
Freshservice API プロファイル設定
Freshservice 画面右上の Profile Settings から API キーを取得します。Domain はアカウント URL のサブドメインです。
Windows Forms コントロール
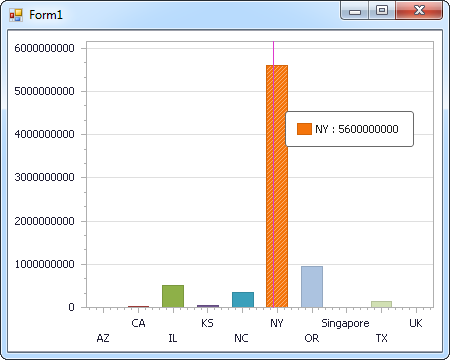
下のコードでは、Freshservice でDevExpress のチャートに追加する方法を説明します。APIDataAdapter はチャートコントロールのSeries プロパティにバインドします。コントロールのDiagram プロパティはx 軸とy 軸をカラム名として定義します。
using (APIConnection connection = new APIConnection(
"Profile=C:\profiles\Freshservice.apip;ProfileSettings='APIKey=your_api_key;Domain=your_subdomain';")) {
  APIDataAdapter dataAdapter = new APIDataAdapter(
  "SELECT Id, Name FROM AgentGroups WHERE Name = 'Support Team'", connection);

  DataTable table = new DataTable();
  dataAdapter.Fill(table);
  DevExpress.XtraCharts.Series series = new DevExpress.XtraCharts.Series();
  chartControl1.Series.Add(series);
  DataTable table = new DataTable();
  series.ValueDataMembers.AddRange(new string[] { "Name" });
  series.ArgumentScaleType = DevExpress.XtraCharts.ScaleType.Qualitative;
  series.ArgumentDataMember = "Id";
  series.ValueScaleType = DevExpress.XtraCharts.ScaleType.Numerical;
  chartControl1.Legend.Visibility = DevExpress.Utils.DefaultBoolean.False;
  ((DevExpress.XtraCharts.SideBySideBarSeriesView)series.View).ColorEach = true;
}
Web コントロール
下のコードではFreshservice でDevExpress Web を操作するための設定方法を説明します。APIDataAdapter はチャートのSeries プロパティにバインドします。Diagram プロパティはx 軸とy 軸をカラム名として定義します。
using DevExpress.XtraCharts;

using (APIConnection connection = new APIConnection(
"Profile=C:\profiles\Freshservice.apip;ProfileSettings='APIKey=your_api_key;Domain=your_subdomain';"))
{
  APIDataAdapter APIDataAdapter1 = new APIDataAdapter("SELECT Id, Name FROM AgentGroups WHERE Name = 'Support Team'", connection);
  DataTable table = new DataTable();
  APIDataAdapter1.Fill(table);
  DevExpress.XtraCharts.Series series = new Series("Series1", ViewType.Bar);
  WebChartControl1.Series.Add(series);
  DataTable table = new DataTable();
  series.ValueDataMembers.AddRange(new string[] { "Name" });
  series.ArgumentScaleType = ScaleType.Qualitative;
  series.ArgumentDataMember = "Id";
  series.ValueScaleType = ScaleType.Numerical;
  ((DevExpress.XtraCharts.SideBySideBarSeriesView)series.View).ColorEach = true;
}